ABSTRACT:
Very preliminary research into peep likes and dislikes for food and drink has revealed that peeps definitely favor certain shops significantly over others, to the point of making the disliked shops economically inviable. However, this initial study also discovered that location greatly impacts the popularity of shops, and these experiments were not designed to isolate that variable. Thus, it is still too early to state definitively what peeps' favorite food and drink are, and by how much, but general trends are already becoming apparent. Water and slush seem to be strong favorites, along maybe with smooties, while juice and coffee are total losers. With food, burgers and hotdogs dominate and Mexican is also popular, with chicken, fries, and pizza all being hated. Proximity to a ride's exit has a huge impact on shop popularity while proximity to a ride's entrance has a much lesser effect. An otherwise unpopular shop adjacent to an entrance, or reasonably close to an exit, will do more business than it otherwise would.
DETAILS:
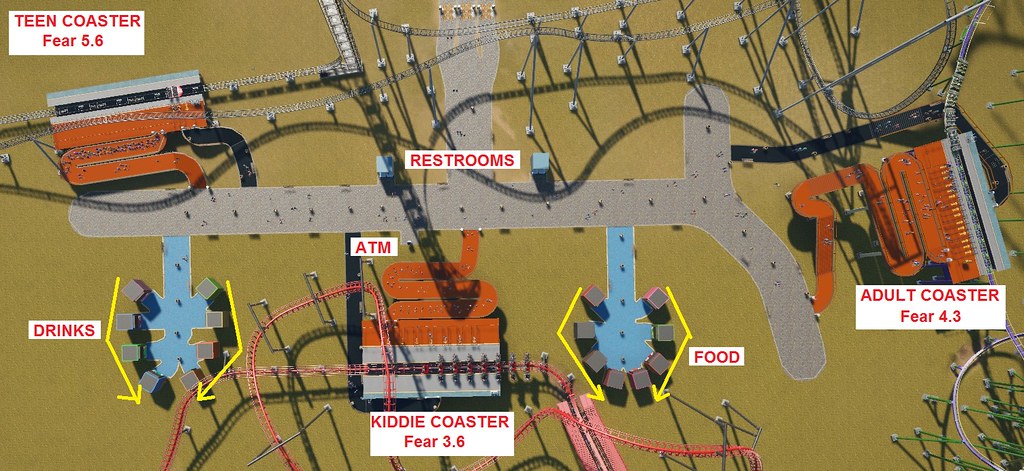
I set up a simple sandbox park with a T-shaped path and 3 coasters as follows:
* A "family" coaster (X-Dimension) with a fear of 3.6 at the T path intersection.
* An "adult" coaster (Anubis) with fear 4.3 some distance down the left arm of the T.
* A "teen" coaster (Dive) with a fear of 5.6 about the same distance down the right arm of the T.
The space between the "family" coaster and the other coasters on either side was occupied by all the different types of food and drink shops in different configurations. There was also a single centrally located ATM and 2 restrooms, one on each arm of the T. The whole path was liberally sprinkled with bins and benches. There were 2 janitors and 1 mechanic. All shop prices were left at default and vendors were left totally untrained so their rate of serving customers would be equal and constant. It was necessary to give some of them pay raises to keep them from quitting during the course of the experiments. Park entrance was free and all 3 coasters cost $10. The park stabilized with about 570 peeps in the park for the duration of these experiments. There was zero scenery anywhere, just the naked rides and shops.
Experiment 1: Food and Drink Courts
Here, single paths originating about halfway between the "family" coaster and those to either side led some distance off the main path. At the end of these branch paths, all the food shops (on the side towards the "adult" coaster) and all the drink shops (on the side towards the "teen" coaster) were in a circular arrangement around the ends of the spur paths. IOW, peeps had to walk about the same distance to all shops, in an attempt to establish baseline popularity. The shops were placed in the order shown on the in-game menu alternating from side to side around the court, with those listed first on the menu being closest to court entrances. This configuration is shown in the pic below.
I then ran the game for 1 month and noted the number of peeps served by each shop. In the case of food, only the 4 shops closest to the court entrance got any business at all. At first I thought this was a product of peeps not knowing about the other shops but when I looked at the drink court, peeps had crossed the center and some of the shops near the court entrance got zero business. This was my 1st indication of peep preferences, but they did not hold up in later experiments. Also, the total number of customers for this month was significantly the lowest during all experiments, apparently because most peeps didn't explore up the spur paths to the courts so were unaware that food and drink shops existed. Anyway, the results were as follows.
Drinks:
* Total customers: 133
* Soda: 39.85% (front of court)
* Smoothies: 29.32% (rear of court)
* Slush: 15.04% (front)
* Water: 12.78% (rear)
* Shakes: 3.01% (rear)
* Energy (front), Juice (rear), and Coffee (rear) all got 0%
Food:
* Total customers: 58
* Ice Cream: 37.93% (front)
* Burgers: 25.86% (front)
* Mexican: 24.14% (front)
* Hotdogs: 12.07% (front)
* Donuts, Fries, Pizza, and Chicken (all rear) got 0%.
Experiment #2: Linear Arrangment Along Main Path
Here, I replaced the courts with all the shops in a row with minimal spacing along the north edge of the main path. The shops were placed in the order listed in the in-game menu starting adjacent to the entrance (drinks) or exit (food) of the "family" coaster. IOW, for drinks, the order from the entrance (going right to left) was shakes, energy, slush, soda, juice, smoothies, water, coffee. For food, the order from the exit (going left to right) was burgers, ice cream, hotdogs, Mexican, donuts, fries, pizza, chicken. Everything else stayed the same. This is shown in the pic below:
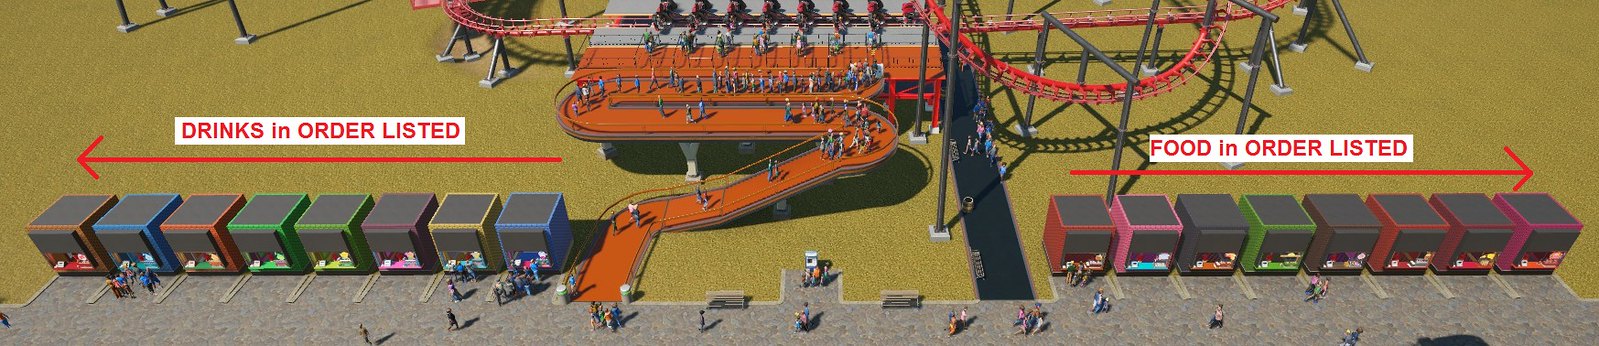
I ran this experiment for 3 months, recording the customers served by each shop at the end of each month. Month-to-month, there was sometimes a large variation in what each shop did. Also, the total number of customers per month changed significantly for both food and drink, generally declining over time for both. I attribute this latter phenomenon to a bunch of hungry and thirsty peeps left over from the court experiment, which gradually went away as more peeps became aware of the food and drink shops. However, despite the changing monthly totals, the trend of selling more drinks than food held true. Anyway, due to the monthly variation, I just averaged all 3 months together and got the following results:
Drinks:
* 3-month total customers: 499
* Shakes: 40.48% (closest to "family" coaster entrance)
* Water: 20.84% (2nd furthest from "family" coaster entrance)
* Slush: 11.22%
* Smoothies: 10.42%
* Energy: 7.21%
* Soda: 6.6%
* Juice: 3.21%
* Coffee: 0.00% (furthest from "family" coaster entrance)
I was rather surprised to see the popularity of shakes given I've hardly ever sold one in a real game and they didn't do well in the court experiement, either. Coffee's continued utter and complete failure was not a surprise at all. But this made me wonder if proximity to a ride's entrance made a difference, so I pursued that in Experiment #3 (see below).
Food:
* 3-month total customers: 469
* Burgers: 51.39 % (closest to "family" coaster exit)
* Mexican: 15.57% (center of line)
* Hotdogs: 11.73%
* Ice Cream: 7.04% (2nd closest to "family" coaster exit)
* Pizza: 5.54% (2nd furthest from "family" coaster exit)
* Chicken: 4.05% (furest from "family" coaster exit)
* Donuts: 2.56% (center of line)
* Fries: 2.13%
The popularity of burgers was not a surprise from previous experience, but given its location adjacent to the ride exit, which I suspected had skewed its numbers based on the results of the drinks, I decided to move it as well. Mexican again made a good showing, comparable to what happened in the court, which I have not seen in actual parks. And of course hotdogs did quite well as expected. Also note that ice cream tanked compared to its performance in the court. But also note that all 4 shops that got zero business in the court also did poorly in the linear formation.
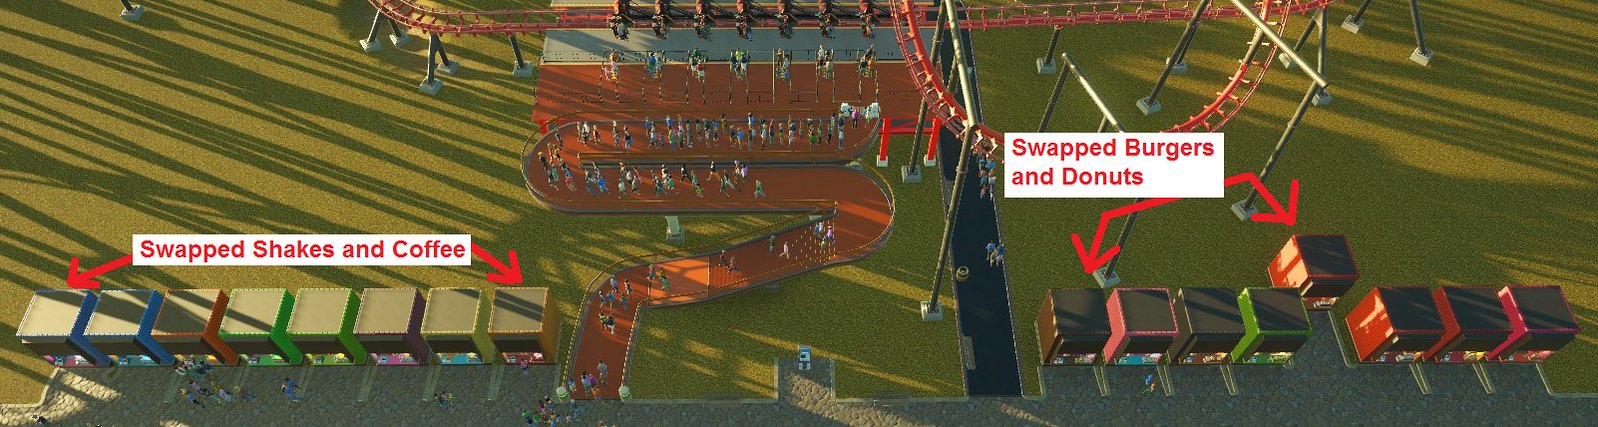
Experiment #3: Swapping Shops
I've never sold a cup of coffee in a real park so it's utter lack of business in the experiments so far were not surprising. However, I've never sold many shakes, either, so I suspected that being positioned adjacent to a ride's entrance was artificially inflating the popularity of shakes in Experiment #2. Therefore, in Experiment #3, I swapped the positions of the shake and coffee shops. Thus, reading from right (adjacent to the ride entrance) to left, the order was now coffee, energy, slush, soda, juice, smoothies, water, shakes.
With food, I knew burgers were always popular but not so overwhelmingly so as in Experiment #2. And I've never sold a donut in a real game, so while donuts weren't quite the lowest performer in experiment #2, I decided to swap them with the burgers. This made the order from left (adjacent to the ride exit) to right donuts, ice cream, hotdogs, Mexican, burgers, fries, pizza, chicken. And due to path issues, the burger shop had to be set back 1 square from where the donut shop had been, so peeps had to walk the farthest to reach it.
The configuration for Experiment #3 is shown below. Again, I ran this experiment for 3 months, noted the totals for each month, and averaged the results.
Drinks:
* 3-month total customers: 514
* Slush: 23.35% (3rd closest to ride entrance)
* Water: 17.51% (2nd furthest from ride entrance)
* Smoothies: 15.37% (3rd furthers from ride entrance)
* Energy: 12.06%
* Coffee: 11.09% (adjacent to ride entrance)
* Soda: 9.92%
* Shakes: 5.45%
* Juice: 5.25%
Food:
* 3-month total customers: 311
* Donuts: 26.05% (closest to ride exit)
* Hotdogs: 23.79% (3rd closest to ride exit)
* Ice Cream: 13.83% (2nd closest to ride exit)
* Mexican: 11.58% (the rest in order further away from ride exit)
* Burgers: 10.29%
* Fries: 5.47%
* Pizza and Chicken: 4.50% each
CONCLUSIONS SO FAR:
1. Proximity to Ride Entrance or Exit
Being adjacent to a ride's entrance increases sales but being relatively close to, but not adjacent to, the entrance doesn't seem to have an effect and peep preferences for specific types of shops control decisions. However, when exiting a ride, peeps have a very strong tendency to patronize the 1st shop they encounter whether they really like it or not. And if that 1st shop's queue is full, they'll go to the next and the next, again without preference seeming to be a major factor in the decision.
2. Peep Drink Preferences
I have previously said that peeps like water and soda the best. That seems not actually to be the case. They definitely like water but also slush. The other top-3 pick seems to be smoothies instead of energy like I used to think. As to the others, coffee and juice seem to be complete losers and the rest are somewhere in between. Both coffee and energy fill peep energy needs but so does sitting on a bench, which costs them nothing. So in parks with lots of benches, you won't sell much of either energy-providing drink.
3. Peep Food Preferences
I have previously stated that peeps like burgers and hotdogs the best and I stand by that. However, Mexican seems to be amongst the top 3 as well, when I used to think that was pizza. Ice cream is also surprisingly popular. But pizza, fries, chicken, and donuts are all failures unless placed adjacent to a ride exit.
4. Shop Ratio Recommendations
Having 2 drinks per 1 food still seems to be a valid ratio in general, although you might tweak this for to 3 drinks and 2 foods where teens are in abundance. For the main areas of the park, having one each water, slush, and burger shops would seem the best bet. In the teen-heavy areas, do that and also maybe add a smoothie and a Mexican shop.
FURTHER RESEARCH
The next obvious steps are to put the drinks on the exit side of the family coaster. Also, putting all the shops on the south side of the main path. And all sorts of other permutations. None of which I particularly want to do and hope to leave as exercises for interested students. I can upload my text park as a Workshop thing if anybody's interested in carrying on with this.
Very preliminary research into peep likes and dislikes for food and drink has revealed that peeps definitely favor certain shops significantly over others, to the point of making the disliked shops economically inviable. However, this initial study also discovered that location greatly impacts the popularity of shops, and these experiments were not designed to isolate that variable. Thus, it is still too early to state definitively what peeps' favorite food and drink are, and by how much, but general trends are already becoming apparent. Water and slush seem to be strong favorites, along maybe with smooties, while juice and coffee are total losers. With food, burgers and hotdogs dominate and Mexican is also popular, with chicken, fries, and pizza all being hated. Proximity to a ride's exit has a huge impact on shop popularity while proximity to a ride's entrance has a much lesser effect. An otherwise unpopular shop adjacent to an entrance, or reasonably close to an exit, will do more business than it otherwise would.
DETAILS:
I set up a simple sandbox park with a T-shaped path and 3 coasters as follows:
* A "family" coaster (X-Dimension) with a fear of 3.6 at the T path intersection.
* An "adult" coaster (Anubis) with fear 4.3 some distance down the left arm of the T.
* A "teen" coaster (Dive) with a fear of 5.6 about the same distance down the right arm of the T.
The space between the "family" coaster and the other coasters on either side was occupied by all the different types of food and drink shops in different configurations. There was also a single centrally located ATM and 2 restrooms, one on each arm of the T. The whole path was liberally sprinkled with bins and benches. There were 2 janitors and 1 mechanic. All shop prices were left at default and vendors were left totally untrained so their rate of serving customers would be equal and constant. It was necessary to give some of them pay raises to keep them from quitting during the course of the experiments. Park entrance was free and all 3 coasters cost $10. The park stabilized with about 570 peeps in the park for the duration of these experiments. There was zero scenery anywhere, just the naked rides and shops.
Experiment 1: Food and Drink Courts
Here, single paths originating about halfway between the "family" coaster and those to either side led some distance off the main path. At the end of these branch paths, all the food shops (on the side towards the "adult" coaster) and all the drink shops (on the side towards the "teen" coaster) were in a circular arrangement around the ends of the spur paths. IOW, peeps had to walk about the same distance to all shops, in an attempt to establish baseline popularity. The shops were placed in the order shown on the in-game menu alternating from side to side around the court, with those listed first on the menu being closest to court entrances. This configuration is shown in the pic below.
I then ran the game for 1 month and noted the number of peeps served by each shop. In the case of food, only the 4 shops closest to the court entrance got any business at all. At first I thought this was a product of peeps not knowing about the other shops but when I looked at the drink court, peeps had crossed the center and some of the shops near the court entrance got zero business. This was my 1st indication of peep preferences, but they did not hold up in later experiments. Also, the total number of customers for this month was significantly the lowest during all experiments, apparently because most peeps didn't explore up the spur paths to the courts so were unaware that food and drink shops existed. Anyway, the results were as follows.
Drinks:
* Total customers: 133
* Soda: 39.85% (front of court)
* Smoothies: 29.32% (rear of court)
* Slush: 15.04% (front)
* Water: 12.78% (rear)
* Shakes: 3.01% (rear)
* Energy (front), Juice (rear), and Coffee (rear) all got 0%
Food:
* Total customers: 58
* Ice Cream: 37.93% (front)
* Burgers: 25.86% (front)
* Mexican: 24.14% (front)
* Hotdogs: 12.07% (front)
* Donuts, Fries, Pizza, and Chicken (all rear) got 0%.
Experiment #2: Linear Arrangment Along Main Path
Here, I replaced the courts with all the shops in a row with minimal spacing along the north edge of the main path. The shops were placed in the order listed in the in-game menu starting adjacent to the entrance (drinks) or exit (food) of the "family" coaster. IOW, for drinks, the order from the entrance (going right to left) was shakes, energy, slush, soda, juice, smoothies, water, coffee. For food, the order from the exit (going left to right) was burgers, ice cream, hotdogs, Mexican, donuts, fries, pizza, chicken. Everything else stayed the same. This is shown in the pic below:
I ran this experiment for 3 months, recording the customers served by each shop at the end of each month. Month-to-month, there was sometimes a large variation in what each shop did. Also, the total number of customers per month changed significantly for both food and drink, generally declining over time for both. I attribute this latter phenomenon to a bunch of hungry and thirsty peeps left over from the court experiment, which gradually went away as more peeps became aware of the food and drink shops. However, despite the changing monthly totals, the trend of selling more drinks than food held true. Anyway, due to the monthly variation, I just averaged all 3 months together and got the following results:
Drinks:
* 3-month total customers: 499
* Shakes: 40.48% (closest to "family" coaster entrance)
* Water: 20.84% (2nd furthest from "family" coaster entrance)
* Slush: 11.22%
* Smoothies: 10.42%
* Energy: 7.21%
* Soda: 6.6%
* Juice: 3.21%
* Coffee: 0.00% (furthest from "family" coaster entrance)
I was rather surprised to see the popularity of shakes given I've hardly ever sold one in a real game and they didn't do well in the court experiement, either. Coffee's continued utter and complete failure was not a surprise at all. But this made me wonder if proximity to a ride's entrance made a difference, so I pursued that in Experiment #3 (see below).
Food:
* 3-month total customers: 469
* Burgers: 51.39 % (closest to "family" coaster exit)
* Mexican: 15.57% (center of line)
* Hotdogs: 11.73%
* Ice Cream: 7.04% (2nd closest to "family" coaster exit)
* Pizza: 5.54% (2nd furthest from "family" coaster exit)
* Chicken: 4.05% (furest from "family" coaster exit)
* Donuts: 2.56% (center of line)
* Fries: 2.13%
The popularity of burgers was not a surprise from previous experience, but given its location adjacent to the ride exit, which I suspected had skewed its numbers based on the results of the drinks, I decided to move it as well. Mexican again made a good showing, comparable to what happened in the court, which I have not seen in actual parks. And of course hotdogs did quite well as expected. Also note that ice cream tanked compared to its performance in the court. But also note that all 4 shops that got zero business in the court also did poorly in the linear formation.
Experiment #3: Swapping Shops
I've never sold a cup of coffee in a real park so it's utter lack of business in the experiments so far were not surprising. However, I've never sold many shakes, either, so I suspected that being positioned adjacent to a ride's entrance was artificially inflating the popularity of shakes in Experiment #2. Therefore, in Experiment #3, I swapped the positions of the shake and coffee shops. Thus, reading from right (adjacent to the ride entrance) to left, the order was now coffee, energy, slush, soda, juice, smoothies, water, shakes.
With food, I knew burgers were always popular but not so overwhelmingly so as in Experiment #2. And I've never sold a donut in a real game, so while donuts weren't quite the lowest performer in experiment #2, I decided to swap them with the burgers. This made the order from left (adjacent to the ride exit) to right donuts, ice cream, hotdogs, Mexican, burgers, fries, pizza, chicken. And due to path issues, the burger shop had to be set back 1 square from where the donut shop had been, so peeps had to walk the farthest to reach it.
The configuration for Experiment #3 is shown below. Again, I ran this experiment for 3 months, noted the totals for each month, and averaged the results.
Drinks:
* 3-month total customers: 514
* Slush: 23.35% (3rd closest to ride entrance)
* Water: 17.51% (2nd furthest from ride entrance)
* Smoothies: 15.37% (3rd furthers from ride entrance)
* Energy: 12.06%
* Coffee: 11.09% (adjacent to ride entrance)
* Soda: 9.92%
* Shakes: 5.45%
* Juice: 5.25%
Food:
* 3-month total customers: 311
* Donuts: 26.05% (closest to ride exit)
* Hotdogs: 23.79% (3rd closest to ride exit)
* Ice Cream: 13.83% (2nd closest to ride exit)
* Mexican: 11.58% (the rest in order further away from ride exit)
* Burgers: 10.29%
* Fries: 5.47%
* Pizza and Chicken: 4.50% each
CONCLUSIONS SO FAR:
1. Proximity to Ride Entrance or Exit
Being adjacent to a ride's entrance increases sales but being relatively close to, but not adjacent to, the entrance doesn't seem to have an effect and peep preferences for specific types of shops control decisions. However, when exiting a ride, peeps have a very strong tendency to patronize the 1st shop they encounter whether they really like it or not. And if that 1st shop's queue is full, they'll go to the next and the next, again without preference seeming to be a major factor in the decision.
2. Peep Drink Preferences
I have previously said that peeps like water and soda the best. That seems not actually to be the case. They definitely like water but also slush. The other top-3 pick seems to be smoothies instead of energy like I used to think. As to the others, coffee and juice seem to be complete losers and the rest are somewhere in between. Both coffee and energy fill peep energy needs but so does sitting on a bench, which costs them nothing. So in parks with lots of benches, you won't sell much of either energy-providing drink.
3. Peep Food Preferences
I have previously stated that peeps like burgers and hotdogs the best and I stand by that. However, Mexican seems to be amongst the top 3 as well, when I used to think that was pizza. Ice cream is also surprisingly popular. But pizza, fries, chicken, and donuts are all failures unless placed adjacent to a ride exit.
4. Shop Ratio Recommendations
Having 2 drinks per 1 food still seems to be a valid ratio in general, although you might tweak this for to 3 drinks and 2 foods where teens are in abundance. For the main areas of the park, having one each water, slush, and burger shops would seem the best bet. In the teen-heavy areas, do that and also maybe add a smoothie and a Mexican shop.
FURTHER RESEARCH
The next obvious steps are to put the drinks on the exit side of the family coaster. Also, putting all the shops on the south side of the main path. And all sorts of other permutations. None of which I particularly want to do and hope to leave as exercises for interested students. I can upload my text park as a Workshop thing if anybody's interested in carrying on with this.
") . Thanks for doing some research in that direction.
. Thanks for doing some research in that direction.
