Price sharing - price sanity check algorithms

There are quite a few online resources that collect/crowdsource and distribute/share price data. In the various entering or collecting processes there are situations where bad/invalid data gets captured.

I am interested in discussing algorithms for the cleaning, verifying or sanity checking price data.

For each commodity, I guess there is a sensible range for the buy price and the sell price. The idea of course is to eliminate/ignore prices that are outside these ranges. But what methodology to we use to establish the valid ranges? How do we know if a price makes sense? Assuming we have alot of data in a database, we can find the average buy/sell, the min/max buy/sell. We can get the standard deviation too - does it mean anything in this context to use in establishing a valid range?

If we decide what a valid range is for a buy price or a sell price, do we delete everything outside that range OR do we delete one value (the Max or Min) and then recalculate the range?

Firstly - if the buy is 0 and the sell is 0 then the price is ignored/deleted. I will post some algorithms I have considered in another msg. What do others use?

This is NOT a discussion of the merits of sharing price data so please if you think it's wrong then it may be better for you to move along.
 

wolverine2710

Tutorial & Guide Writer
A very interesting thread. Wanted to post in the EDDN thread but you ninja-ed me ;-) I've taken the liberty to create a post about it in the 3rd party tools thread and also put it in the OP, section "announcement". I think this thread deserves all the exposure it can get.

I DO have some suggestions, not for an algorithms but usage by other tools. This time I will keep quit for a while and let others have a go at it. Beeing to visible already in the forums ;-(
 
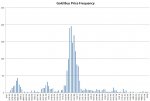
This chart shows the distribution of Gold Buy prices that have been recorded across a sample of 4000 stations since release.

Gold Buy Price Histogram.jpg

It can be seen that there are a few 'bell'-type curves in there. I expect these are probably due to the economy types at different stations. The small bell-curve on the left is probably what we are interested in for considering a low-buy limit. A low buy limit is critical as incorrectly low buy prices will attract traders. ie: if Gold is reported (incorrectly) somewhere for 4000 instead of the minimum 8707 in the table, then it will attract traders incorrectly.

Similarly, traders are attracted to high sell prices. So if they are incorrect then traders are attracted there incorrectly.

How do we programatically establish the parameters of the small bell curve at the left and then establish a low-buy limit?
 
This chart shows the distribution of Gold Sell Prices across 4000 stations where the buy price was 0 (not sold).

Gold Sell Price Histogram.jpg

The few prices at the left are probably incorrect, not that the sell price is incorrect, but that the corresponding buy price at the station was not recorded so the sell price gets included in the table. But that's not of too much concern in this table. It is a high sell price limit that we are interested in so that we can filter out high sells that are probably recorded incorrectly. As with the buy price histogram, a few economy-specific curve seem to emerge. How do we parameterize the right-most curve and use it to establish a high sell limit.

Another consideration is whether the limits should be based on existing data at all. We might have a good sample size of data to extrapolate what sensible prices are, but we may not.

I am not a statistician, is there someone who deals with this kind of data who can give some advice?
 
eddb is working with preset price ranges already. I checked all commodities and took min_buy_price - 10% and max_sell_price + 10%, excluding the wrong submits. This is actually working pretty good since the wrong prices are usually off by a factor of ten.
 
I recently added price checking to the site after adding an importer for eliteOCR as mistakes started throwing things off. I looked at the data and found sensible min/max range then asked users to let me know when they found verifiable prices out of the range. After a day of tweeking I ended up with these ranges:

MinMax
Advanced Catalysers23503400
Agri-Medicines7001850
Algae25270
Aluminium190500
Animal Meat9001700
Animal Monitors160490
Aquaponic Systems140440
Atmospheric Processors240600
Auto-Fabricators32004400
Basic Medicines180480
Battle Weapons60007500
Bauxite45300
Beer65310
Bertrandite18503000
Beryllium74009200
Bioreducing Lichen7001300
Biowaste10390
Chemical Waste60150
Clothing170490
Cobalt4501000
Coffee10001700
Coltan10501800
Combat Stabilisers24003350
Computer Components350750
Consumer Technology59507600
Copper300700
Crop Harvesters17953100
Domestic Appliances350750
Explosives160470
Fish250600
Food Cartridges30280
Fruit and Vegetables170480
Gallite15002400
Gallium45005900
Gold825010500
Grain80350
H.E. Suits150440
Hydrogen Fuel80170
Imperial Slaves1500017600
Indite18002700
Indium52006700
Land Enrichment Systems40006100
Leather65310
Lepidolite360900
Liquor430900
Lithium12002000
Marine Equipment35404900
Microbial Furnaces85350
Mineral Extractors360830
Mineral Oil80330
Narcotics60300
Natural Fabrics240600
Non-Lethal Weapons13002250
Palladium1180014500
Performance Enhancers59507650
Personal Armor36004800
Personal Weapons36004900
Pesticides100370
Platinum1770020000
Polymers40290
Power Generators350750
Progenitor Cells60007600
Reactive Armour16002500
Resonating Separators50006700
Robotics14002250
Rutile180510
Scrap20130
Semiconductors6001200
Silver40505600
Slaves1010012000
Superconductors60007600
Synthetic Fabrics75330
Synthetic Meat115410
Tantalum34004600
Tea11001900
Titanium7001400
Tobacco41005600
Uraninite6001200
Uranium22003200
Water Purifiers160470
Wine130410
 
I'm not a programmer, but the answer looks intuitive to me

1. IF X has Highest_Frequency for all Data Points below Average THEN set X as Low_Value_Marker
2. IF Y has Highest_Frequency for all Data Points above Average THEN set Y as High_Value_Marker

Estimate drop-off curve on both sides of both markers, and flag any data point that deviates from expectations.
And yes, always cut off the extreme High and Low values.
 
Last edited:
We can get the standard deviation too - does it mean anything in this context to use in establishing a valid range?

By default, Quazil's uses 3 standard deviations on the EDDN feed, and that seems to have been working well. There is no correction, outside that band they are filtered out.
 
Applying cutoff's seems the right way...
And it's good to look for the distributions of the spread between buy and sell for each commodity and crop the values outside too, because you can have values inside the distribution, but wrong in the spread. I mean a "correct" (that pass thru the cutoffs) value for buy and sell, but they can be too different (one too low and the other too high or being inverted).
 
I recently added price checking to the site after adding an importer for eliteOCR as mistakes started throwing things off. I looked at the data and found sensible min/max range then asked users to let me know when they found verifiable prices out of the range. After a day of tweeking I ended up with these ranges:

MinMax
Advanced Catalysers23503400
Agri-Medicines7001850
Algae25270
Aluminium190500
Animal Meat9001700
Animal Monitors160490
Aquaponic Systems140440
Atmospheric Processors240600
Auto-Fabricators32004400
Basic Medicines180480
Battle Weapons60007500
Bauxite45300
Beer65310
Bertrandite18503000
Beryllium74009200
Bioreducing Lichen7001300
Biowaste10390
Chemical Waste60150
Clothing170490
Cobalt4501000
Coffee10001700
Coltan10501800
Combat Stabilisers24003350
Computer Components350750
Consumer Technology59507600
Copper300700
Crop Harvesters17953100
Domestic Appliances350750
Explosives160470
Fish250600
Food Cartridges30280
Fruit and Vegetables170480
Gallite15002400
Gallium45005900
Gold825010500
Grain80350
H.E. Suits150440
Hydrogen Fuel80170
Imperial Slaves1500017600
Indite18002700
Indium52006700
Land Enrichment Systems40006100
Leather65310
Lepidolite360900
Liquor430900
Lithium12002000
Marine Equipment35404900
Microbial Furnaces85350
Mineral Extractors360830
Mineral Oil80330
Narcotics60300
Natural Fabrics240600
Non-Lethal Weapons13002250
Palladium1180014500
Performance Enhancers59507650
Personal Armor36004800
Personal Weapons36004900
Pesticides100370
Platinum1770020000
Polymers40290
Power Generators350750
Progenitor Cells60007600
Reactive Armour16002500
Resonating Separators50006700
Robotics14002250
Rutile180510
Scrap20130
Semiconductors6001200
Silver40505600
Slaves1010012000
Superconductors60007600
Synthetic Fabrics75330
Synthetic Meat115410
Tantalum34004600
Tea11001900
Titanium7001400
Tobacco41005600
Uraninite6001200
Uranium22003200
Water Purifiers160470
Wine130410

Do you apply the limits to the sell price only, or also to the buy price?
 
Back
Top Bottom