This project of yours is so dang cool but is going to be a bottomless pit of compute cycles. One of these days we're really going to have to figure out hooking you up with some better infrastructure and/or tooling. What does all this run on now, if you don't mind sharing?Test runs take 1-2 hours when using the full data, so it's slow going.")
You are using an out of date browser. It may not display this or other websites correctly.
You should upgrade or use an alternative browser.
You should upgrade or use an alternative browser.
ED Astrometrics: Maps and Visualizations
- Thread starter Orvidius
- Start date
OK, I have a pretty good map going now. It's near linear in several color bands and then crams the larger numbers into just a few more at the end of the color key. I've added this to the maps page, and to the interactive map. Click the image for the full size view, or you can see the interactive map here: https://edastro.com/galmap/
This project of yours is so dang cool but is going to be a bottomless pit of compute cycles. One of these days we're really going to have to figure out hooking you up with some better infrastructure and/or tooling. What does all this run on now, if you don't mind sharing?
Yeah, it gets tricky. This project has forced me to do some efficient coding, and smart chunking of the data. I even upgraded hardware at one point since I was running out of RAM.
The web server and the player history video maker are all running on a virtual server. It's great for what it does, but it lacks the CPU speed, RAM, and disk storage (yes all three) to handle the database and the scripts that make the maps and spreadsheets. So all of that runs on my home server, which is primarily a file and email server, but mostly sat idle before building all of this. It's running Linux on a Core i7-8700 with 64 GB of RAM and a couple of terabytes of SSD in RAID 1. Now I can run several of the scripts simultaneously. But even so, on the days where it recalculates the maps and spreadsheets, the whole process takes several hours, probably around 5 or so now.
I like it! Playing with it a bit -- the interactive map makes it really easy to blink back and forth between the two -- and the new map does a much better job of bringing out the details in high traffic areas. Around the bubble, it's possible to clearly make out the Guardian area and stuff around the Barnard's Loop locked sectors. Away from the bubble, the details of the Colonia highway and the DW2 waypoints also stand out more sharply. I would definitely like to keep both maps as an option though, since the new map is very dark in super-low-traffic zones, and it would be a shame to lose visibility on those little trails left by individuals and small groups.OK, I have a pretty good map going now. It's near linear in several color bands and then crams the larger numbers into just a few more at the end of the color key. I've added this to the maps page, and to the interactive map. Click the image for the full size view, or you can see the interactive map here: https://edastro.com/galmap/
Interesting. That's not too badly spec'ed for a single machine setup, and I think it should be able to run faster than that. It doesn't take that long to stream a few hundred gigs off SSDs, and the aggregation operations you're doing should be relatively cheap. You mentioned Perl before, so I suppose everything is single threaded though. Have you been able to figure out where the bottlenecks are? Consider this an offer to help out if you want it, as this has drifted pretty close to what I do for a living so I might be able to offer useful insight.So all of that runs on my home server, which is primarily a file and email server, but mostly sat idle before building all of this. It's running Linux on a Core i7-8700 with 64 GB of RAM and a couple of terabytes of SSD in RAID 1. Now I can run several of the scripts simultaneously. But even so, on the days where it recalculates the maps and spreadsheets, the whole process takes several hours, probably around 5 or so now.
Whoa! That is some incredible work you've done there Orvidius
Thanks, yeah I've spent a lot of time tuning the scripts. Perl isn't the fastest language of course, and a fair amount of what I'm doing is single-threaded just due to the nature of what I'm doing. When you have multiple GB of data in RAM, there's a lot of overhead in trying to share between threads. I've tried a few strategies and most of them ended up not being worth the effort. The map maker script gets around this a little by aggregating data by location, forking children to deal with those chunks, and reporting pixel-level summaries back to the parent. Plus it draws the maps in parallel to each other so that there's only one pass on the database and data loop, but that makes it very memory-hungry. Spawning off multiple scripts simultaneously also works as a sort of pseudo-multithreading. Having it run for hours isn't really that big of a problem, since the updates are 48 hours apart. A lot of it is also unavoidable just due to how large the data set is. And of course the MySQL database and the scripts are running on the same box, so there's some contention for resources there too.
The aggregation is more expensive than it looks at first glance, and in fact this is probably the slowest part of the whole process (a good 90-120 minutes in the map maker, down from 3+ hours before I added the multithreading). To do any better I would probably have to completely rethink that phase. It effectively has to read in and collate 42 million star systems and their bodies, into lots of high resolution arrays on a per-map basis. It makes my head spin when I try to think of it that way. lol What would probably be more efficient would be to build one master copy of the system/body arrays and have all of the images decide what they need from it, rather than have the aggregator loop split it out to each of the image arrays up front. But that's a design change for a later date.
I do this stuff for a living too. Just as a server engineering/scripting context rather than application development.
The aggregation is more expensive than it looks at first glance, and in fact this is probably the slowest part of the whole process (a good 90-120 minutes in the map maker, down from 3+ hours before I added the multithreading). To do any better I would probably have to completely rethink that phase. It effectively has to read in and collate 42 million star systems and their bodies, into lots of high resolution arrays on a per-map basis. It makes my head spin when I try to think of it that way. lol
What would probably be more efficient would be to build one master copy of the system/body arrays and have all of the images decide what they need from it, rather than have the aggregator loop split it out to each of the image arrays up front. But that's a design change for a later date.I do this stuff for a living too.
Just as a server engineering/scripting context rather than application development.
Last edited:

You know what I love about EDAstro, other than the epic travel videos it makes, is the Thargoid compass rose.
So, circling back around to this discussion. It's clear you've already picked the low-hanging fruit here, so most likely large gains are only going to come from large changes. It does jump out at me that adding multithreading sped up the map maker by less than a factor of two - makes me suspect you are limited by either disk or memory I/O contention there, not processing power. Am I correctly understanding that your maps start out in memory as ~8000x8000x1000 arrays (presuming your voxels are 10 LY cubes)? If so, yes, those certainly take up some space!Thanks, yeah I've spent a lot of time tuning the scripts. Perl isn't the fastest language of course, and a fair amount of what I'm doing is single-threaded just due to the nature of what I'm doing. When you have multiple GB of data in RAM, there's a lot of overhead in trying to share between threads. I've tried a few strategies and most of them ended up not being worth the effort. The map maker script gets around this a little by aggregating data by location, forking children to deal with those chunks, and reporting pixel-level summaries back to the parent. Plus it draws the maps in parallel to each other so that there's only one pass on the database and data loop, but that makes it very memory-hungry. Spawning off multiple scripts simultaneously also works as a sort of pseudo-multithreading. Having it run for hours isn't really that big of a problem, since the updates are 48 hours apart. A lot of it is also unavoidable just due to how large the data set is. And of course the MySQL database and the scripts are running on the same box, so there's some contention for resources there too.
The aggregation is more expensive than it looks at first glance, and in fact this is probably the slowest part of the whole process (a good 90-120 minutes in the map maker, down from 3+ hours before I added the multithreading). To do any better I would probably have to completely rethink that phase. It effectively has to read in and collate 42 million star systems and their bodies, into lots of high resolution arrays on a per-map basis. It makes my head spin when I try to think of it that way. lol
I do this stuff for a living too.
To help me understand the constraints better, I'm probably going to bite the bullet and download the full EDSM dataset here and do some experiments with it. I'm curious to try loading the full thing into RAM so I can see how fast the queries can run if only limited by memory bandwidth (I do have access to servers with multi-TB of RAM, but sadly probably can't just let you have one). Then, more practically, see if I can apply some out-of-core processing techniques and see if that yields anything practical. I'm curious to see if something like Vaex could be helpful here. (Informative conference talk here:
)
You know what I love about EDAstro, other than the epic travel videos it makes, is the Thargoid compass rose.
Thanks! Yeah, once that idea popped into my head, I had to make it happen.
So, circling back around to this discussion. It's clear you've already picked the low-hanging fruit here, so most likely large gains are only going to come from large changes. It does jump out at me that adding multithreading sped up the map maker by less than a factor of two - makes me suspect you are limited by either disk or memory I/O contention there, not processing power. Am I correctly understanding that your maps start out in memory as ~8000x8000x1000 arrays (presuming your voxels are 10 LY cubes)? If so, yes, those certainly take up some space!
To help me understand the constraints better, I'm probably going to bite the bullet and download the full EDSM dataset here and do some experiments with it. I'm curious to try loading the full thing into RAM so I can see how fast the queries can run if only limited by memory bandwidth (I do have access to servers with multi-TB of RAM, but sadly probably can't just let you have one). Then, more practically, see if I can apply some out-of-core processing techniques and see if that yields anything practical. I'm curious to see if something like Vaex could be helpful here. (Informative conference talk here:Source: https://www.youtube.com/watch?v=ELtjRdPT8is
)
Probably lots of memory contention, yes. The way I'm doing it puts a huge burden on memory up front, being processed through some heavy logic, by splitting the data out to all these different arrays for each of the images right in the first pass, and I could alleviate a lot of that by aggregating and bucketizing first, and letting the image passes take what they need subsequently. The design I've used was fine when it was drawing only one or two maps, and made sense then, but not when it's making a few dozen of them.
Thankfully I'm not doing it as voxels. That would hurt.... a lot.
But what I'm doing is still rather memory hungry. As it chunks through the data from the database, it pulls a batch of rows for star systems, and then pulls all of the bodies associated with those IDs, so each chunk is only three SQL selects. Those go very quickly. Here's the poorly scalable design choice: When it loops over those, it "draws" RGB color totals to arrays using X,Y coordinates (with the side views already translated into this), with the third "dimension" being the color channel. These are cumulative summations of the RGB colors associated with each thing, with the array sizes already fitted to the final image resolutions. The image-drawing pass goes over these to calculate logarithmic scales to bring them back down into appropriate ranges and then draws them to the image canvas. Instead I should be storing total counts of objects rather than total RGB values for each. But the bigger memory savings would probably come from storing counts for each body type, mass code, age range, systems, etc only once each, whereas right now they could be drawing to multiple images in memory simultaneously, across three color channels each. I think I'm past that tipping point. For a while RGB was cheaper to store.Something that is pretty telling is that the child processes finish up their work very quickly, and the parent bottlenecks on looping over the results and storing it all into the arrays.
So I've identified a pretty good bottleneck; it's mainly at the point of deciding when to do the rewrite.
Heh, so I've been going down some interesting rabbit holes over the last week, running some experiments with performance tuning and aggregation strategies for the image drawing scripts. Nothing has really worked out well. Pre-aggregation strategies and generic aggregation within the script have all turned out to be quite a bit more expensive than drawing straight to the pre-image arrays, so the way I'm doing it currently seems to be the cheaper option.
That's both gratifying (to know that I was already doing pretty well) and simultaneously disappointing (that the experiments didn't bear much fruit). So I'm going to shelve performance tuning for now. It's been a strange journey, but it's not exactly wasted time either, since it's given my a pretty good tour of my process and getting a better idea of what I shouldn't do. LOL.
That's both gratifying (to know that I was already doing pretty well) and simultaneously disappointing (that the experiments didn't bear much fruit). So I'm going to shelve performance tuning for now. It's been a strange journey, but it's not exactly wasted time either, since it's given my a pretty good tour of my process and getting a better idea of what I shouldn't do. LOL.
Replying to your post from the GMP thread, since this would be off-topic there:
About those exceptionally rare WWTC parents for ELWs: if I'm correct, there are only two? HIP 35755 and V711 Tauri. Both are terraformed ELWs however, so for the purposes of natural ELWs, they don't count.
The problem with such scenarios, and ELMs in general, is the existence of the atmospheric moon temperature bug. For a parent WWTC below, there's also the problem that the ELM has to end up with the right kind of atmosphere - and too much water "down below" might contribute too much water to the would-be-ELM, heating it up past the 320 K limit.
(I suspect that the greenhouse effect of atmospheric water in Elite is overexaggerated, might even be via an extra zero typo, but I don't have nearly enough proof.) Then there's also that terraformed ELWs are outside of the normal bounds of natural ELWs, so candidacy is a bit of a mess too.
Hey, thanks! That's a pleasant surprise.I took this opportunity to add parent landable/terraformable states to the full ELW list on EDastro. It looks like we have about 441 that orbit terraformable worlds, nearly all of which are HMCs with just a couple of WWs thrown in. So that makes it fairly rare, but those terraformable WWs as the parent body are exceptionally rare.
About those exceptionally rare WWTC parents for ELWs: if I'm correct, there are only two? HIP 35755 and V711 Tauri. Both are terraformed ELWs however, so for the purposes of natural ELWs, they don't count.
The problem with such scenarios, and ELMs in general, is the existence of the atmospheric moon temperature bug. For a parent WWTC below, there's also the problem that the ELM has to end up with the right kind of atmosphere - and too much water "down below" might contribute too much water to the would-be-ELM, heating it up past the 320 K limit.
(I suspect that the greenhouse effect of atmospheric water in Elite is overexaggerated, might even be via an extra zero typo, but I don't have nearly enough proof.) Then there's also that terraformed ELWs are outside of the normal bounds of natural ELWs, so candidacy is a bit of a mess too.
OK, I must have a bug in my code then, because I told the script to only mark the terraforming state as "yes" if it contains "candidate", which the hand-placed terraformed worlds don't have. They just show up as "Terraformed" in the data. I'll see if I can see what went wrong. If that's the case, then those two are erroneous in my spreadsheet and thus the rest should all be HMCs.
Actually never mind, I'm confusing the two bodies. The parents in these cases are correctly flagged since they do show as "candidate" WWs in the data. So the spreadsheet is OK.
But yeah, we can probably ignore those two cases since the ELWs are terraformed, so that still leaves terraformable WWs as parent bodies as something yet to be discovered in a proc-gen system.
But yeah, we can probably ignore those two cases since the ELWs are terraformed, so that still leaves terraformable WWs as parent bodies as something yet to be discovered in a proc-gen system.
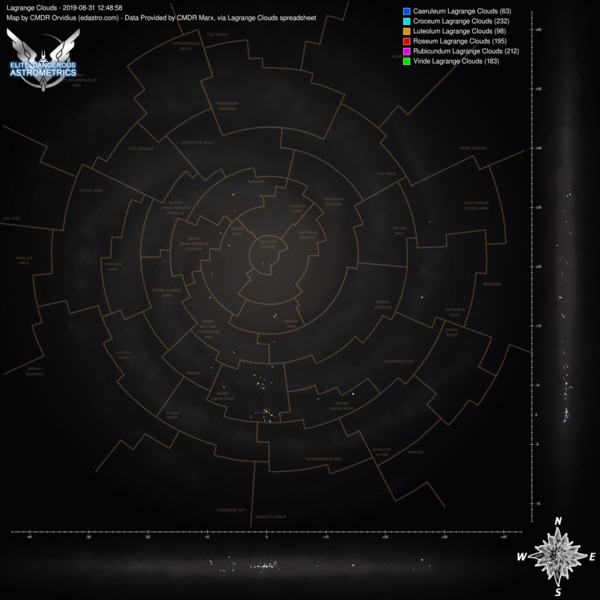
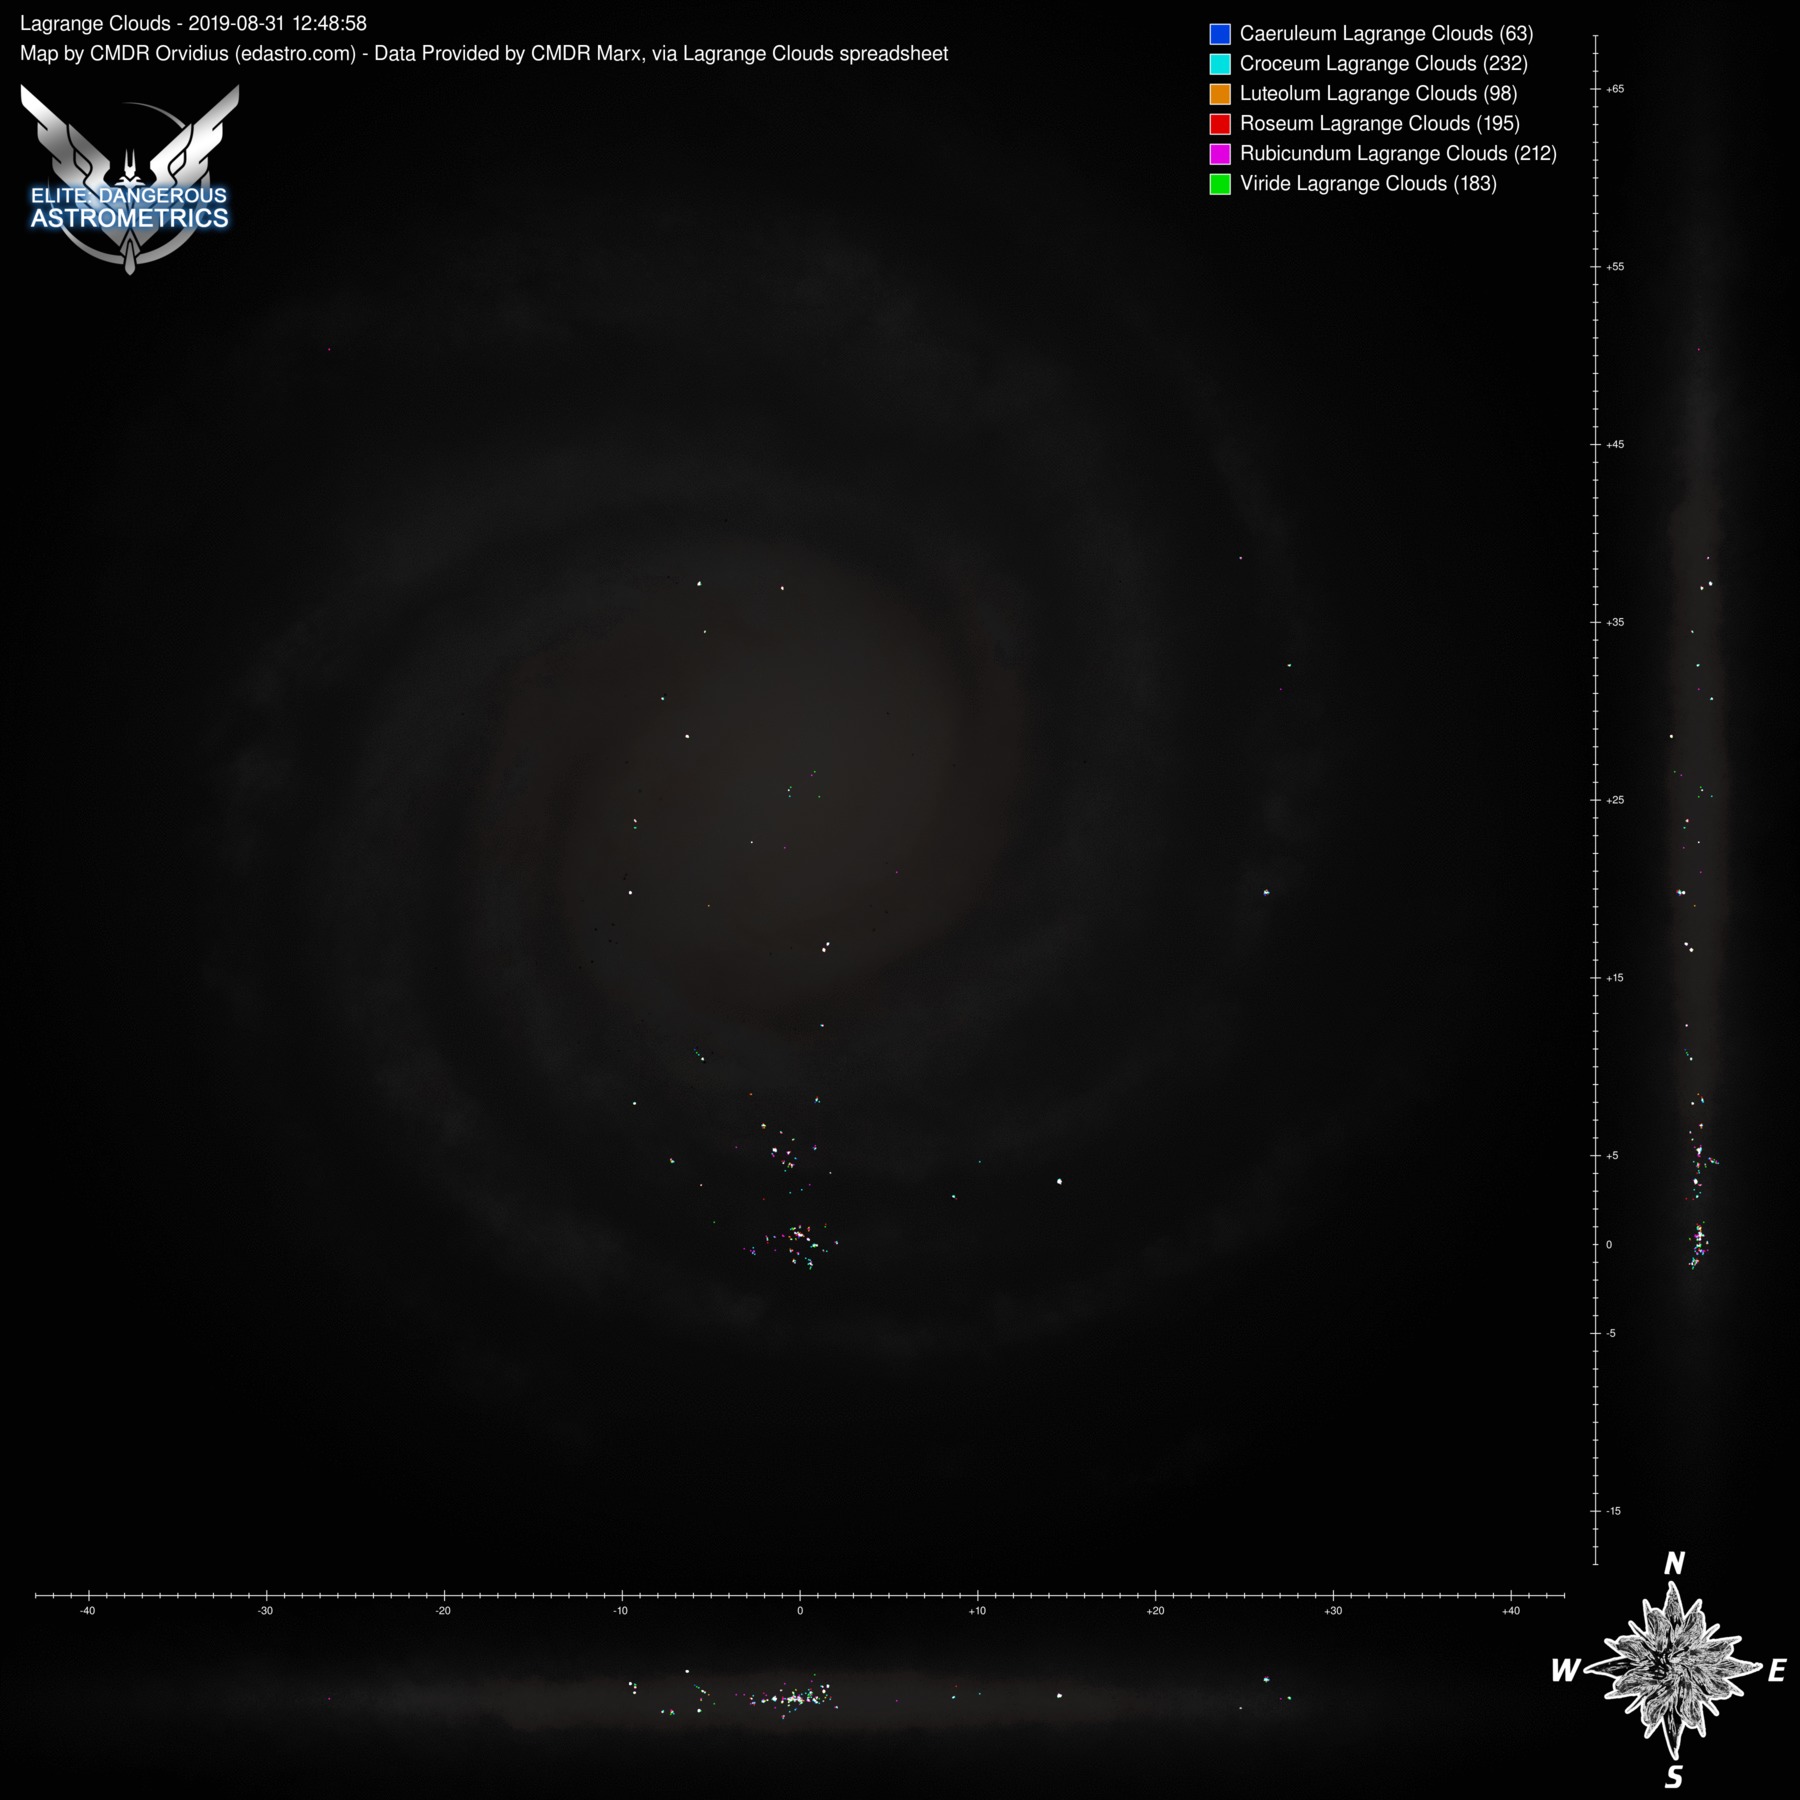
These aren't automated, since we don't have an auto-updating data source, but marx provided a list of lagrange clouds that I was able to use to make some map images. Here are two sets, one with PLCs and one without, with each set having versions with the region lines and without.
Click any of them to see the full size image:

Click any of them to see the full size image:
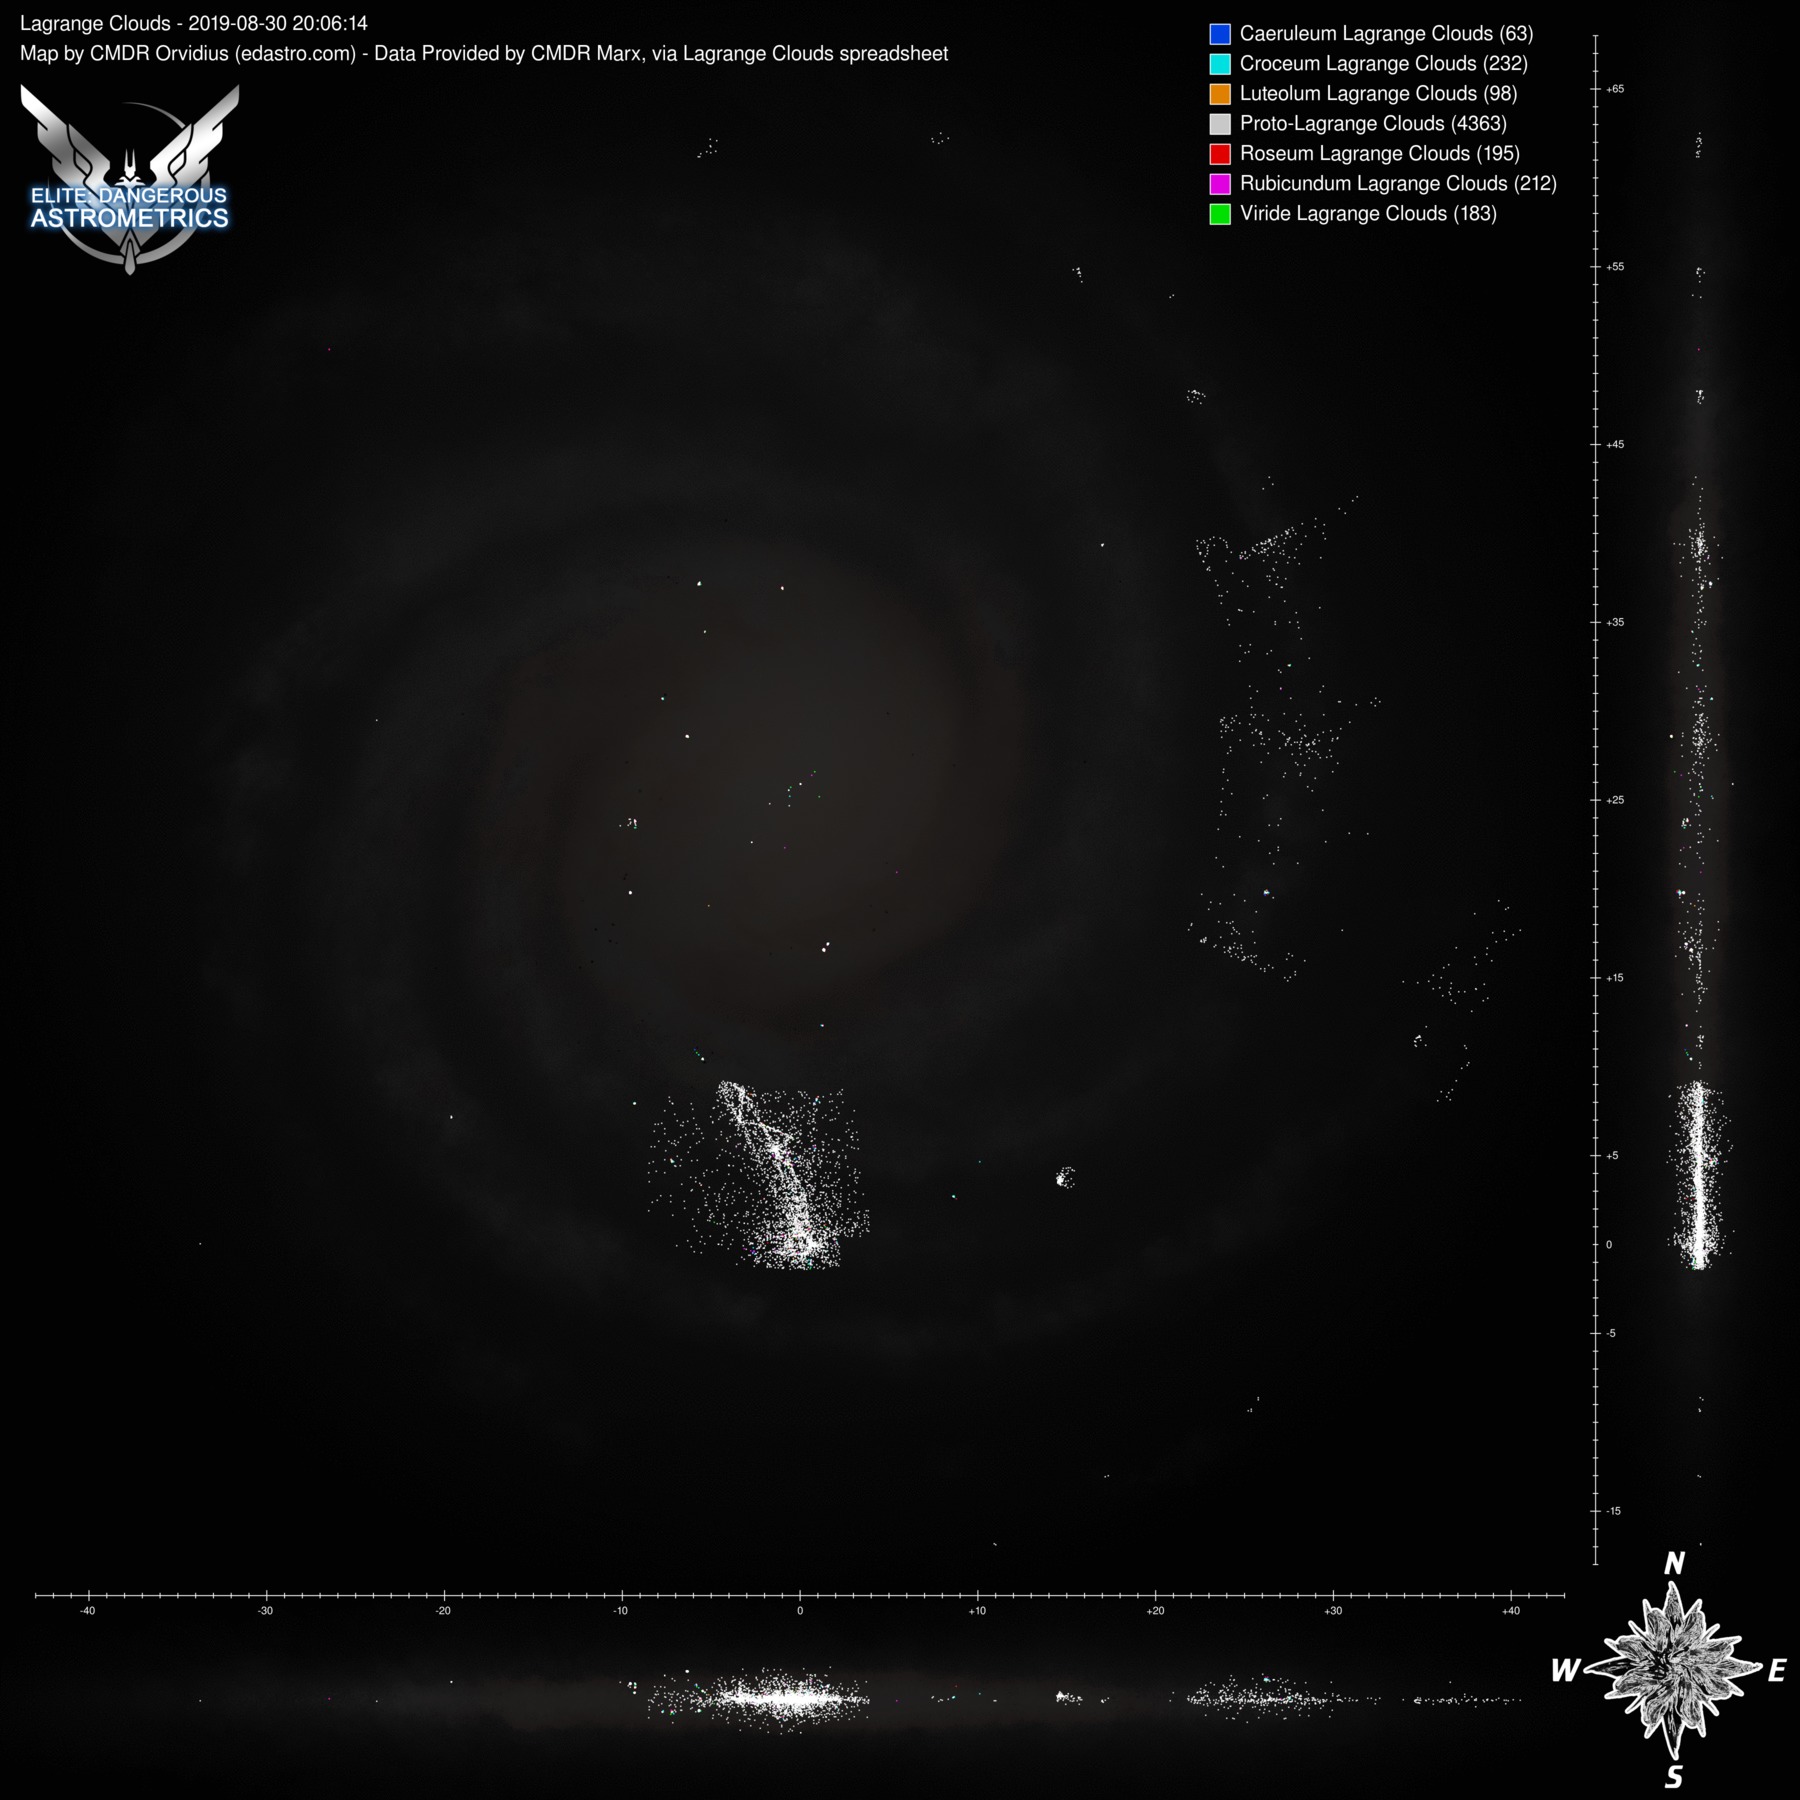
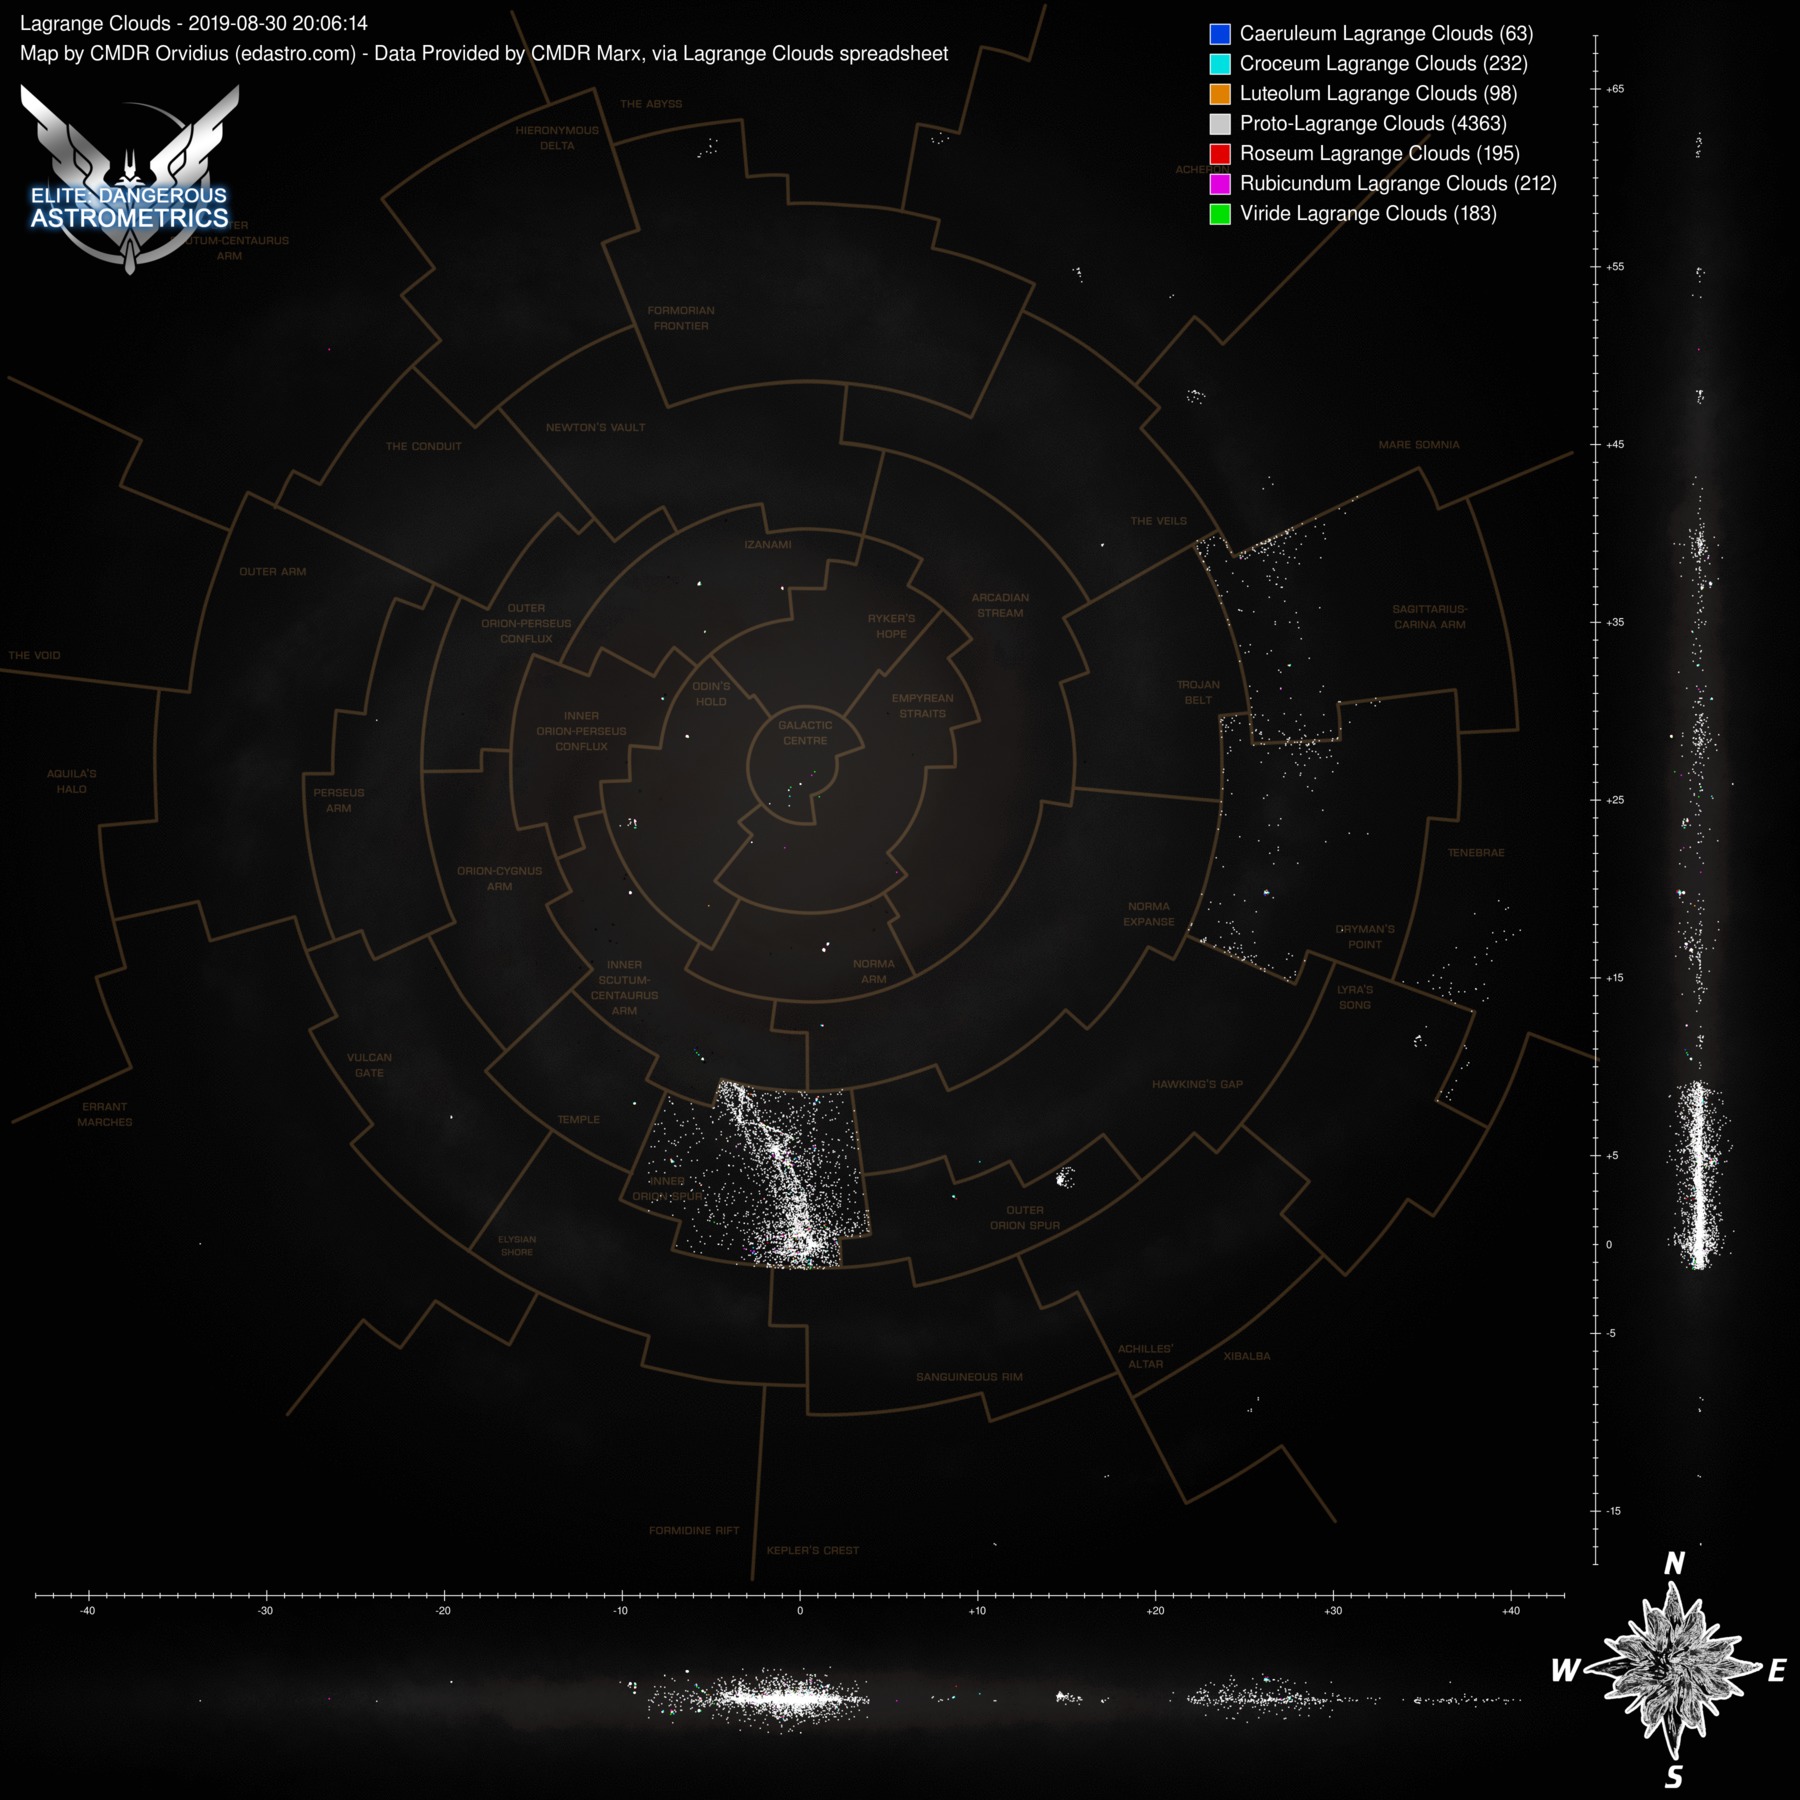
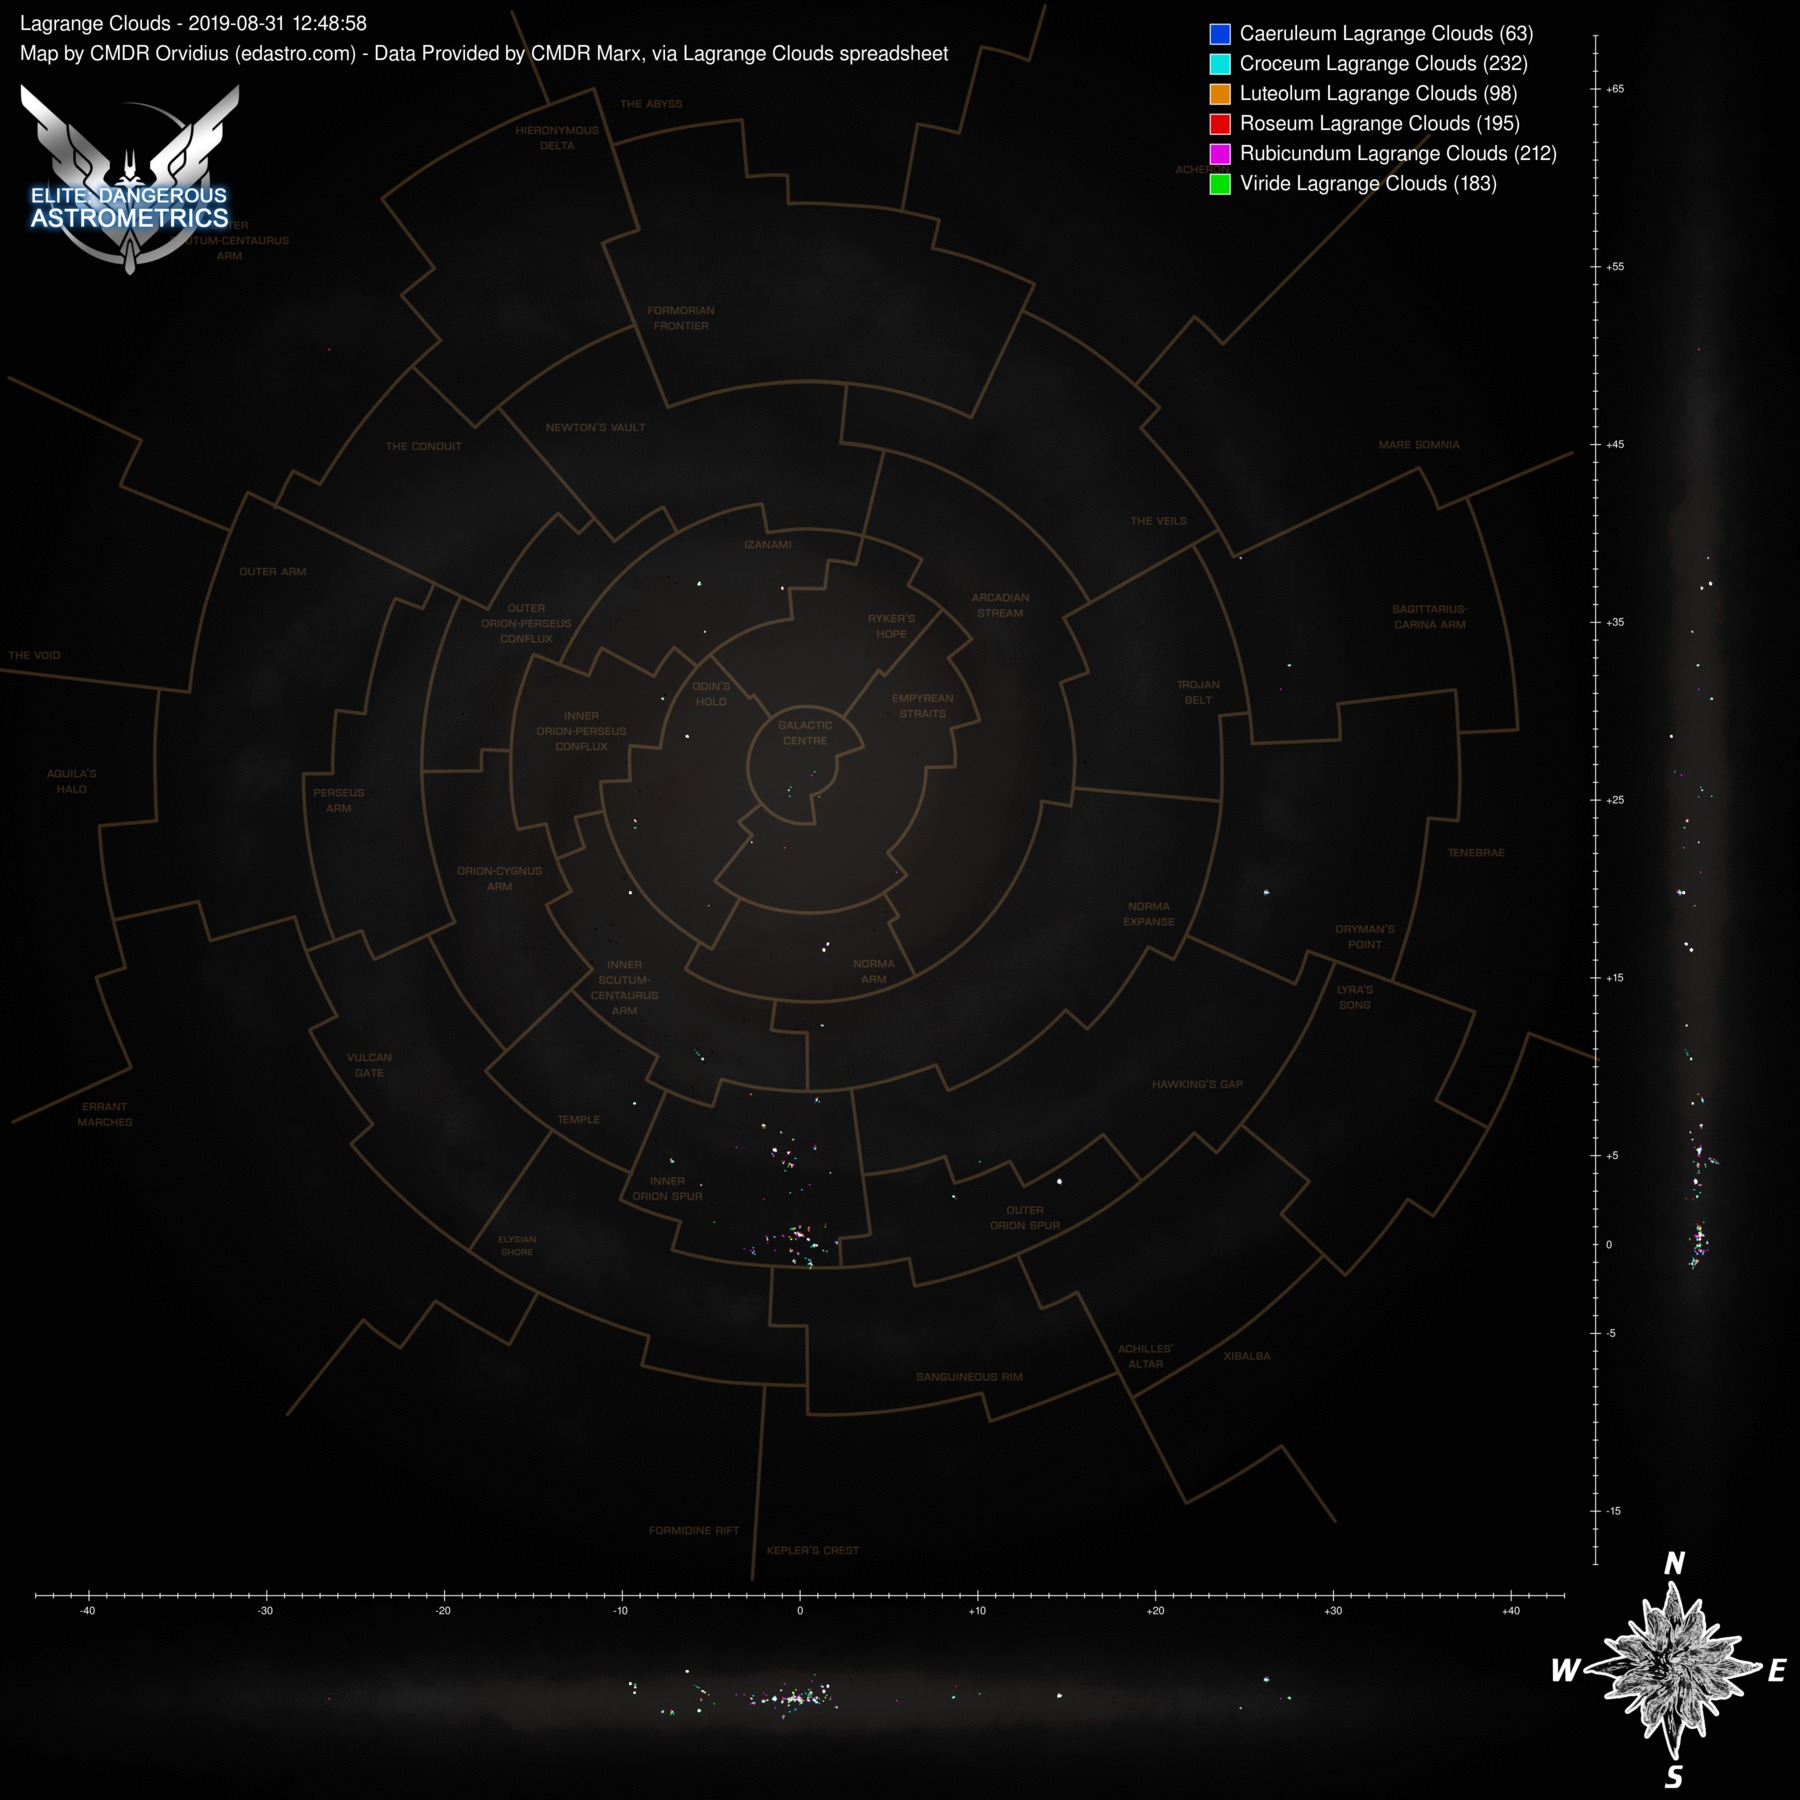
Wow. That is... impressive The distribution of NSPs looks very different for different regions.
And the bright spots in the Outer Orion Spur appear to be around Eta Carina and NGC 3199 nebulae? Looks like at least some of the other compact "spots" of NSP's locations also have something to do with the local nebulae.
The distribution of NSPs looks very different for different regions.And the bright spots in the Outer Orion Spur appear to be around Eta Carina and NGC 3199 nebulae? Looks like at least some of the other compact "spots" of NSP's locations also have something to do with the local nebulae.
Last edited:
Yeah. Take a look at the maps without PLCs, so only the colourful clouds: they are in or around nebulae. (Including planetary ones.)And the bright spots in the Outer Orion Spur appear to be around Eta Carina and NGC 3199 nebulae? Looks like at least some of the other compact "spots" of NSP's locations also have something to do with the local nebulae.
What also surprised me was how few the storm clouds were. The total numbers of various kinds: 0/4/2/2/2/1. Zero meaning that I assume that Caeruleum storm clouds exist, just nobody has found one yet. In other words, storm clouds are even rarer than GGGs.
Wow, I knew the storm clouds were rare, but I didn't realize there were fewer than the GGGs. Yikes.
Also, I'm super happy that the region lines are lining up so nicely. I initially drew the region overlay by doing a higher resolution redraw over the Codex map, and then flew around to some of the in-game intersections and took note of coordinates to calibrate it. I'm super happy that it's pretty well aligned.
Also, I'm super happy that the region lines are lining up so nicely. I initially drew the region overlay by doing a higher resolution redraw over the Codex map, and then flew around to some of the in-game intersections and took note of coordinates to calibrate it. I'm super happy that it's pretty well aligned.
FYI the maps are currently not updating. I'm aware of the issue, and am investigating. The OS update last week broke the image processing, and I haven't yet figured out where the incompatibility is. The good news is that the data is still updating, and so the spreadsheets should be fine. The images will just stay frozen until I can sort this out.