I did the math. It's a linear line, but there are three separate lines, one for each of exploited, fortified, and strongholds.
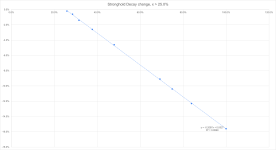
- The equation for absolute CP loss for strongholds is new_inf = 1,000,000 * (-0.2087 * old_inf + 0.0527 ), where old_inf>25.0%
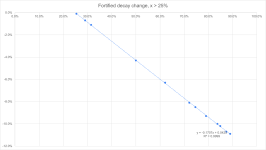
- The equation for absolute CP loss for fortifieds is new_inf = 650,000 * (-0.1707 * old_inf + 0.0425), where old_inf>25.0%
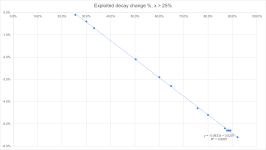
- The equation for absolute CP loss for exploiteds is new_inf = 350,000 * (-0833 * old_inf + 0.0207), where old_inf>25.0%
- The order of operations is { promotion, decay }
Methodology
- I visited ~ 40 systems just before the cycle ended. I obtained another 7 systems from another power (identity redacted for now). I deliberately chose backwater systems with less than 0.1% UM in Cycle 36, that had points across the control score spectrum. I only had time for 40 systems before the cycle ended. The other power had already obtained these values for their data.
- I took the data from Inara.cz for the %, which I believe to the be the same as in the journal files
- Once the game came back, I visited 47 systems and scanned them with tools into Inara.cz (you can see that update to replicate my effort).
- I took the updated data from Inara.cz and entered it into the sheet.
- I scatter plotted the data. It didn't look good for a single equation. I added a trendline, and then ticked the box to add an equation and to add the R value. This showed two things: 1) I needed to exclude data < 25% and that I needed three separate scatter plots. Once I did that, I had three perfectly straight lines, with R = 0.999.
- I validated that the cycle 36 data obtained from the other power fits perfectly, so I am satisfied that the data from the other power is sound.
I plotted scatter plots for INF > 25% to find the curve, expecting a curve. It's a linear line. The equations are as above.
Excel source file here:
https://1drv.ms/x/c/dd17ceffa52ddf7f/ETY3VTzelVBMjanKYAG-RXEB6tO93d-qtTptqPpLRIcZ2Q?e=bfiTU0
Analysis of order of operations
Before the cycle, we had no idea if it would be { decay, promotion } or { promotion, decay }, so I deliberately chose three to be promoted systems. The order is { promotion, decay }, but there's something funky going on because the newly promoted control points are lower than expected. I would expect a system that ended up at 102.8% would end up at 2.8% fortified, but didn't. It's probably because of 350,000 versus 650,000 versus 1,000,000, so the % is based upon the absolute CP once in the new scale.
Conclusion
It's HORRIFIC for strongholds. So much wasted CP. You are welcome to make your own analysis, but I think mine will bear up. The order of operations is { promotion, decay }, so do the moonshot for key systems in a single cycle, or waste a LOT of CP.

 we're back at massive grinding and micromanagement overhaul.
 ...
...