UNKNOWN ARTEFACT: Sound Engineers, apply here!

I am taking a "vacation" for a while... :)

Good luck with that... If you're anything like me these things have a habit of dragging you back ;)

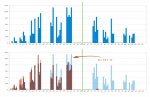
Have a few idea on the frequency distributions and adjacencies that I will start looking into next week and will report back.

I have also been thinking of putting together a quick video guide on transcribing using audacity if anyone is interested? I can demonstrate things like removing the howls using inverted waves, working with spectrums and using timings to identify missing bits. It is actually pretty easy to accurately transcribe once you know how, and you can do it entirely visually without needing to rely on aurally interpreting noisy and overlapping samples. If we can get a consistent and accurate method, it will reduce the need for duplication of effort and should set us up well for the next of of UAs we find! If anyone would find that useful let me know, but if not then I'll put the time into other investigations.
 
A new pattern?

So here's another pattern I don't think has been mentioned yet - rather than looking at the frequencies of the bit sequences I thought it might be interesting to look at the frequencies of the true/false bits in the various positions. Turns out there is something in it:

Using Mr Hidden's transcriptions there is a very interesting pattern (apologies for formatting - it doesn't seem to like the way I'm lining thing up... Sure you can figure out what I mean!) :


Bit 1 Bit 2 Bit 3 Bit 4 Bit 5 Bit 6 Bit 7
----- ----- ----- ----- ----- ----- -----
True 265 163 169 214 181 167 110
False 125 226 220 174 188 165 108

Ratio 2.12 0.72 0.77 1.23 0.96 1.01 1.02

I would put bits 2 - 7 down to random chance, but not bit 1. There are more than twice as many true bits in this position than false.

This makes me think the first bit may very well serve a different purpose to the remainder and when looking at the distribution of the sequences it would be worth seeing if there are any clearer patterns if the first bit is excluded. This would reduce the possible alphabet space significantly.

 
Last edited:
Good luck with that... If you're anything like me these things have a habit of dragging you back ;)

Yeah, it's very probable. ;)

Nice find with the last bit ratio, it doesn't seems to be a coincidence. I tried to use it blindly as a sign bit before, without this statistics. I tried it for simple conversion to characters (but it doesn't work, the value range is too high) and also for 2D coords test (it gives nothing, too). So it will be probably relevant a different way. (or it may simply mean there is more large numbers than smaller ones)
Also, for any tests I suggest to try also negated bits (so low pitch tones = 1, high pitch tones = 0). As far as I remember, some Voyager record has it that way.
 
Last edited:
My apologies for not having read the preceding posts. The opening post segments the signal into howl, chittering, purrs, and more howls.
While listening to UA1 by digitalscream I noticed that it's not segmented at all. The chittering and the purrs are also present at the time of the howls, did anyone else notice this?

I normalized UA1 in Audacity to increase the volume and then played it at 2x speed. You can hear that there are 2 purrs during the howl sounds. Maybe morse code for the whole signal counting the purrs untill the object dies?
 
Let's see what you will discover in Murp's recording... :)

Only just got to looking at this one, and again I disagree with the transcription based on the spectrogram. I'm 100% sure this is 10011 not 10001.

Sadly this is a short and a low quality capture with a lot of background noise. I also had to download it from YouTube, which probably also added lots of compression artefacts that further obscure things. This is where the visual guide of the spectrogram really becomes useful:

spec_009.png

Looking at the distances between the horizontal marks in the signatures for 0 and 1 shows this is a 1 (compare it to the 1 immediately to the right and you will see the marks are perfectly aligned). The clip was not long enough for me to be able to find a suitable howl that I could use to remove the obscuring howl, but in this case it isn't really necessary.

In my mind the adjacency rule still stands true a the moment :)
 
Only just got to looking at this one, and again I disagree with the transcription based on the spectrogram. I'm 100% sure this is 10011 not 10001.

Sadly this is a short and a low quality capture with a lot of background noise. I also had to download it from YouTube, which probably also added lots of compression artefacts that further obscure things. This is where the visual guide of the spectrogram really becomes useful:

View attachment 34953

Looking at the distances between the horizontal marks in the signatures for 0 and 1 shows this is a 1 (compare it to the 1 immediately to the right and you will see the marks are perfectly aligned). The clip was not long enough for me to be able to find a suitable howl that I could use to remove the obscuring howl, but in this case it isn't really necessary.

In my mind the adjacency rule still stands true a the moment :)

Yeah I was mostly using it so people on the subreddit could get a better view of the thing, since other people seemed to have the HQ sound side covered. Also so we could see if the sound changed over distance, which didn't require very high quality to tell. I made the mistake of recording it near a station and people ended up mistaking the stations broadcasts for the UAs, so that was bad :p
 
My apologies for not having read the preceding posts. The opening post segments the signal into howl, chittering, purrs, and more howls.
While listening to UA1 by digitalscream I noticed that it's not segmented at all. The chittering and the purrs are also present at the time of the howls, did anyone else notice this?

I normalized UA1 in Audacity to increase the volume and then played it at 2x speed. You can hear that there are 2 purrs during the howl sounds. Maybe morse code for the whole signal counting the purrs untill the object dies?

It is known that the howls are sometimes laid overtop of the chittering. And, I think, that the chittering sound continues throughout(?), but we use this phrasology for ease of reference.

When I say "chittering" I mean the lack of howls or purrs between the last howl (with or without associated purrs) and the next purr.
When I say "howl" I mean that loud "whale noise", which may or may not contain a purr (or two). "Howl" is much shorter to type than "whale noise".

The problem is that decoding a Morse Code message (especially one so long as this message seems to be) is computationally impossible without some indication of at least letter breaks.

EDIT: Fixed formatting.

EDIT 2:

Only just got to looking at this one, and again I disagree with the transcription based on the spectrogram. I'm 100% sure this is 10011 not 10001.

Well that's good. That was really troubling me.
 
Last edited:
Yeah I was mostly using it so people on the subreddit could get a better view of the thing, since other people seemed to have the HQ sound side covered. Also so we could see if the sound changed over distance, which didn't require very high quality to tell. I made the mistake of recording it near a station and people ended up mistaking the stations broadcasts for the UAs, so that was bad :p

No worries, was not meant as any kind of critisism. It does give us more data, which is what we need at the moment ;)

Really hoping we can get hold of some more - from one of the other threads it seems someone has spotted the convoy again - and can then find a way to stabilise them to get a better and longer recording.

Sure you'll in the Vanguard of any search and capture mission again. Good luck commander :)
 
Phyl: Alright, I will make a proper changes in transcription.

In any case, I noticed another interesting thing today (despite I thought that I will take a vacation from it). As I was looking on my graph above, I tried another thing. I calculated frequency of decimals from negated bits and graph looks as on picture below and things are more obvious (ignore the relative column heights in comparison):
1. There is "divider" on value 64 and both sides are pretty clearly "mirrored"
2. When "right side" mirrored (x=127-x), it match the "left side" by the value groups and also briefly by it's frequency
3. After this change, there is another "divider" at value 32. Both sides can be mirrored again (x=63-x) and value groups match. I believe similar thing can be made on value 16 as a divider.

There is clearly some well defined and probably pretty simple algorithm/principle in it. And because my brain cells have a strike and I really need a break, I am rising a question - WHY IS IT THAT WAY? Any ideas?

View attachment 34957
 

Attachments

  • graph2.jpg
    graph2.jpg
    81.6 KB · Views: 395
Last edited:
Yes, but why is it that way? If I take reverse approach and I will have a value, let's say (and expect it is a source value), 37. From which reason it stay 37 and from which reason it becomes 90? There must be something behind it.
 
Last edited:
Yes, but why is it that way? If I take reverse approach and I will have a value, let's say (and expect it is a source value), 37. From which reason it stay 37 and from which reason it becomes 90? There must be something behind it.

It is because 37 in binary is 0100101 where as 90 is 1100101 - the only difference is the first bit, which is 2^6 therefore there is symmetry around that point.

Maybe this will help visualise better - the two columns are 7 bits split around 2^6 and aligned. The excluded patterns are shaded red and you can see they align perfectly (I assume these also align with your graphs). You can also see the 37 and 90 are both on the same row, which is the effect you are talking about above.

excel.png
 
Last edited:
I think we don't understand each other. :)
My point is - why are values that way, I am looking for a cause, not the consequences. It's obvious that 37 and 90 are the same bit representation, but ^1. But, I want to find a principle of that value distribution. For example, why there are no values between 55-72 and so on?
 
Former passive sonar analyst in Royal Navy, may my services be of use? I'm no sound engineer but I have a great ear for low frequency sounds. I may just give it a go with techniques I know and see if I can turn up anything
 
I think we don't understand each other. :)
My point is - why are values that way, I am looking for a cause, not the consequences. It's obvious that 37 and 90 are the same bit representation, but ^1. But, I want to find a principle of that value distribution. For example, why there are no values between 55-72 and so on?

It is because the values between 55-72 all contain at least 3 zeros or 3 ones so are not valid sequences as we know there can only be a maximum of 2 adjacent identical bits. The red highlighted cells on my screenshot are the values excluded due to this rule.
 
It is because the values between 55-72 all contain at least 3 zeros or 3 ones so are not valid sequences as we know there can only be a maximum of 2 adjacent identical bits. The red highlighted cells on my screenshot are the values excluded due to this rule.

Yes, and why there are no 000/111 sequences in the signal? Why Frontier's/Thargoid's encrypting algorithm does that? That's the point. If we figure it out, we will be able to do the same in reverse order and get the initial source data. :)
 
Last edited:
Yes, and why there are no 000/111 sequences in the signal? Why Frontier's/Thargoid's encrypting algorithm does that? That's the point. If we figure it out, we will be able to do the same in reverse order and get the initial source data. :)

I see your point, however there are a thousand different ways that could be achieved. I think we just need to accept it is what it is, and and try to work within those parameters - especially as we do not know what algorithms the thargoids or whoever else created this may favour.
 
In my opinion we cannot seriously move forward if we do not discover that algorithm - it's the key. Now we have some points - we know what code/values it produces. We know how are value groups set and how is rough frequency distribution within these groups. It seems much easier to me than on the beginning, it's a real lead. And there won't be so much algorithms that produces exactly this type of code and also gives some sensible results. But, of course, any other research that may produce additional hints will help... :)
 
Last edited:
In my opinion we cannot seriously move forward if we do not discover that algorithm - it's the key. Now we have some points - we know what code/values it produces. We know how are value groups set and how is rough frequency distribution within these groups. It seems much easier to me than on the beginning, it's a real lead. And there won't be so much algorithms that produces exactly this type of code and also gives some sensible results. But, of course, any other research that may produce additional hints will help... :)

This would tend to imply some kind of cypher is being used. I'm still working on the theory that there is just a restriction on the number of sequences used in their comms - perhaps just because they just felt like it - only once I'm convinced this is not the case do I think it is worth looking for additional algorithms. In fact, that is probably when I give up as the search space is just too huge for it to be feasible unless there is some kind of human (or non-human) error - or clue!
 
Former passive sonar analyst in Royal Navy, may my services be of use? I'm no sound engineer but I have a great ear for low frequency sounds. I may just give it a go with techniques I know and see if I can turn up anything

Do me a favor and listen to the "Chittering" in some UA-Sounds and compare them to some i transformed (and here). Is is imagination or is there somethin in that chittering?

Thanks!
 
Back
Top Bottom