(this is an offshoot from this thread: https://forums.frontier.co.uk/index.php?threads/red-giant-or-not-red-giant.510896/ )
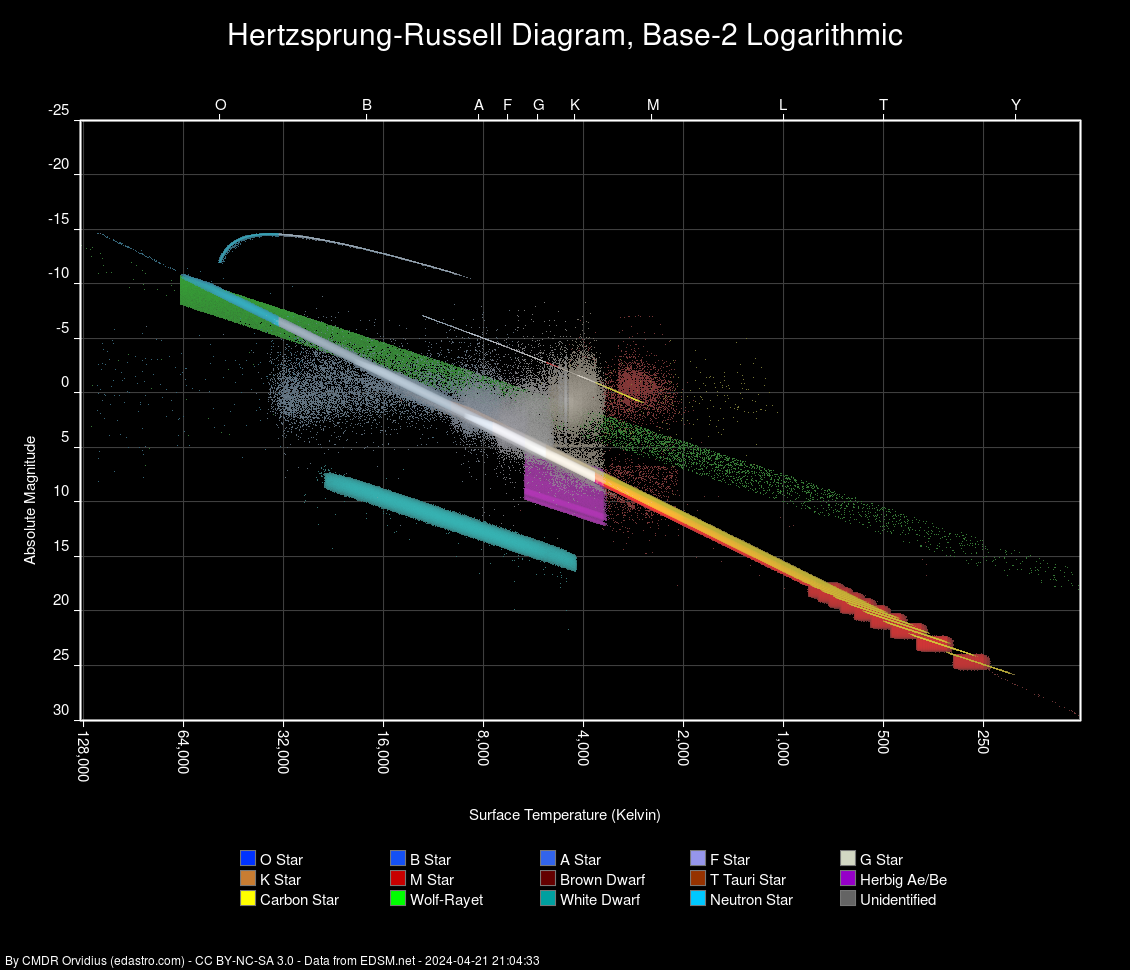
I tried doing a plot of Stellar Temperature (x axis) vs Log L on the y axis - calculated from Abs Mag by L = 10^((4.83 - M)/2.5)) - for the 5000 or so stars I've catalogued in ED (excluding neutron stars and black holes, which are way off the chart or break it). Since the y axis is Log L that means 0 is 1 LS, 2 is 100 LS, 4 is 10,000 LS etc, and -2 is 0.01 LS, -4 is 0.0001 LS, etc.
It doesn't quite look the same as the classic H-R diagram... but it's kinda similar? The long line is the main sequence. The short thick line below it seems to be White Dwarfs, and the shorter thin line above the middle seems to be M Red Giants. Not sure what the other bits outside the main sequence are yet (e.g. the curve above it at the top left, and the cluster between the MS and WDs) but I can investigate later.

I also could attempt to colour these according to stellar type etc later, this was just a quick and nasty attempt to plot what I had. It also includes Os and Ws at top left of the main sequence and LTY at bottom right.
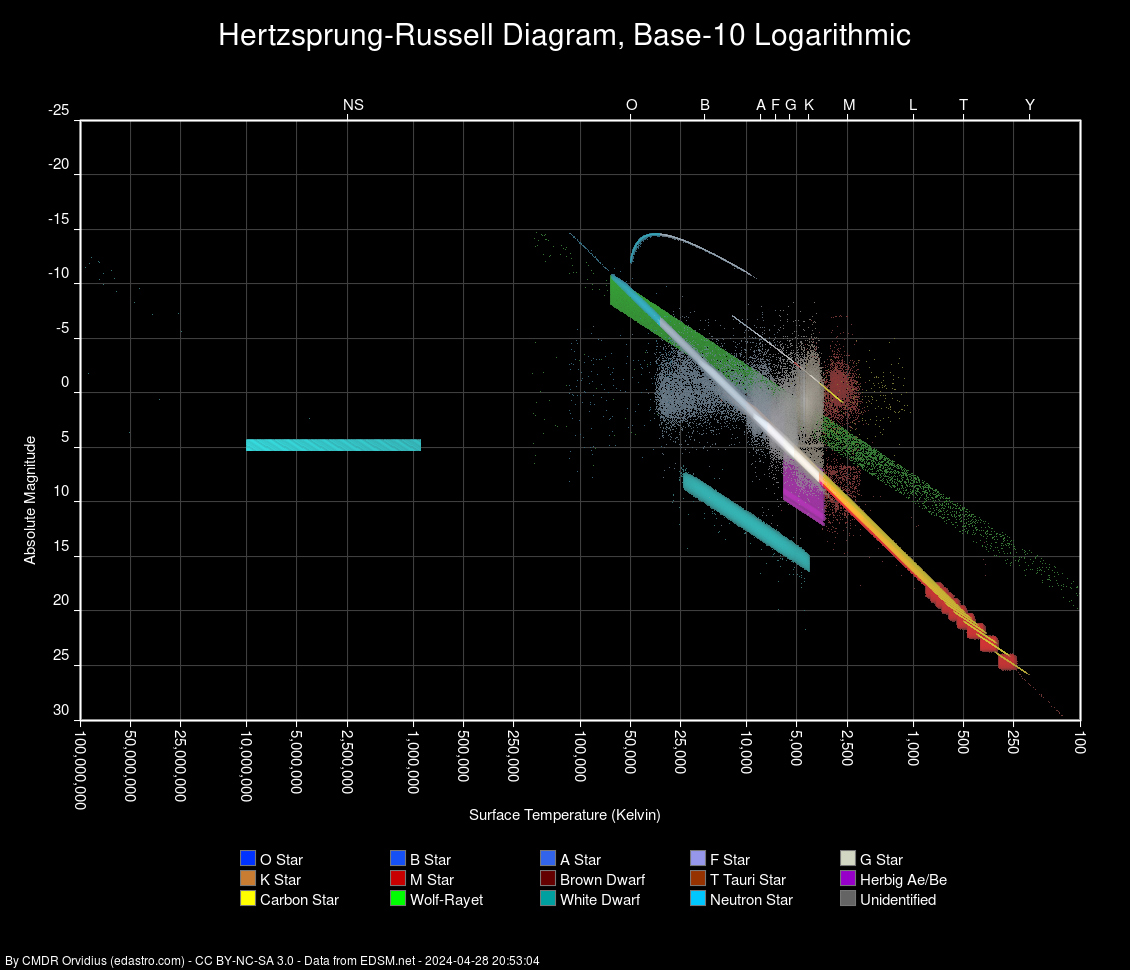
I tried doing a plot of Stellar Temperature (x axis) vs Log L on the y axis - calculated from Abs Mag by L = 10^((4.83 - M)/2.5)) - for the 5000 or so stars I've catalogued in ED (excluding neutron stars and black holes, which are way off the chart or break it). Since the y axis is Log L that means 0 is 1 LS, 2 is 100 LS, 4 is 10,000 LS etc, and -2 is 0.01 LS, -4 is 0.0001 LS, etc.
It doesn't quite look the same as the classic H-R diagram... but it's kinda similar? The long line is the main sequence. The short thick line below it seems to be White Dwarfs, and the shorter thin line above the middle seems to be M Red Giants. Not sure what the other bits outside the main sequence are yet (e.g. the curve above it at the top left, and the cluster between the MS and WDs) but I can investigate later.
I also could attempt to colour these according to stellar type etc later, this was just a quick and nasty attempt to plot what I had. It also includes Os and Ws at top left of the main sequence and LTY at bottom right.
Last edited:
")