You are using an out of date browser. It may not display this or other websites correctly.
You should upgrade or use an alternative browser.
You should upgrade or use an alternative browser.
ED Astrometrics: Maps and Visualizations
- Thread starter Orvidius
- Start date

Multiple times have I run across "Red Giant" stars that are smaller than Sol. Similarly over Xmas I found a system of B-class stars which had radii over 400 times Sol, yet were classed as normal stars.
It is in fact possible to have stars in the "giant" phase of stellar evolution that are still smaller than Sol. Very small red dwarf stars will expand and could still be smaller than Sol. "Giant" isn't always a term of size; it's a term for a phase of the life of the star.
On the other hand, the large radius main-class stars don't make any sense.
OK, map is ready. Interesting results:
This nicely shows the "corridor" FDev stuck into stellar forge on the z-axis, preventing certain objects from spawning. The blue blob around Sol of approximately 20 stellar radii are likely to be all hand-placed stars. There are two very distinct bands of 20-50 solar radii stars at +1K and -1K; I think this is the same place the 'neutron fields' are located. There is also that band of 50 solar radii stars right on the galactic Y-axis center. The larger radii stars seem to be evenly distributed in the same places as the arms, but I notice a huge gap in the north-west corner. That area is less explored, but is it really that much less explored? Or is it an actual gap of large stars?
Indeed, this map seems to pretty much trace the known distribution of neutron stars. I've always suspected the Stellar Forge team was trying to simulate either the Thick Disk or Halo by including a separate population that skews toward older and more evolved stars. Interesting to wonder if the +/- 1K altitude bands are because they wanted those stars away from the galactic plane, or if it's just the third dimension of the exclusion zone "cross".This nicely shows the "corridor" FDev stuck into stellar forge on the z-axis, preventing certain objects from spawning. The blue blob around Sol of approximately 20 stellar radii are likely to be all hand-placed stars. There are two very distinct bands of 20-50 solar radii stars at +1K and -1K; I think this is the same place the 'neutron fields' are located. There is also that band of 50 solar radii stars right on the galactic Y-axis center. The larger radii stars seem to be evenly distributed in the same places as the arms, but I notice a huge gap in the north-west corner. That area is less explored, but is it really that much less explored? Or is it an actual gap of large stars?
I wouldn't be too surprised if that gap is real. There's markedly fewer nebulae on that side of the core too, for no readily apparent reason.
I was wondering about that. Given that there's not all that many giant stars in this dataset to begin with, very plausible that a small but dedicated effort would stand out from the background. If that path you drew represents something like the "true" density of giant stars, then there's quite a lot of them still out there to be found.I'm astonished that the path I flew (the upside down L left to the gap) while scanning carbon stars is is still visible in some of your maps.
Here's a link to the system with the supergiant, that's not a supergiant: https://www.edsm.net/en/system/bodi.../details/idB/164843222/nameB/Aumainks+AA-A+h6
93 Solar Masses, 424 Solar Radius, Class B
Stellar Forge was drunk with this one.
93 Solar Masses, 424 Solar Radius, Class B
Stellar Forge was drunk with this one.
I'm astonished that the path I flew (the upside down L left to the gap) while scanning carbon stars is is still visible in some of your maps.
That was yours? Cool.
Yeah, some of the marks that are on the maps are quite impressive. The few times I've tried specifically to make visible marks, they're hardly noticeable. That's some serious scanning. That was yours? Cool.
I didn't do it because I wanted to leave a mark. Two years ago I suddenly thought 'let's search for carbon stars'. This 'L' is made of more than 4700 carbon stars I found until I got bored.
I was wondering about that. Given that there's not all that many giant stars in this dataset to begin with, very plausible that a small but dedicated effort would stand out from the background. If that path you drew represents something like the "true" density of giant stars, then there's quite a lot of them still out there to be found.
I just scanned an area 200x200 lys wide, there are far more carbon stars than these. One could make this L glow brighter easily by scanning C-stars below them (I scanned from a depth of -1000 to -1200 if I remember correctly).
Last edited:
Well, kind of yeah, but the star at least has to be of proper age for for thatIt is in fact possible to have stars in the "giant" phase of stellar evolution that are still smaller than Sol
I mean, how could for example this particular one burn out to it's final stages of evolution for such a short period of time?

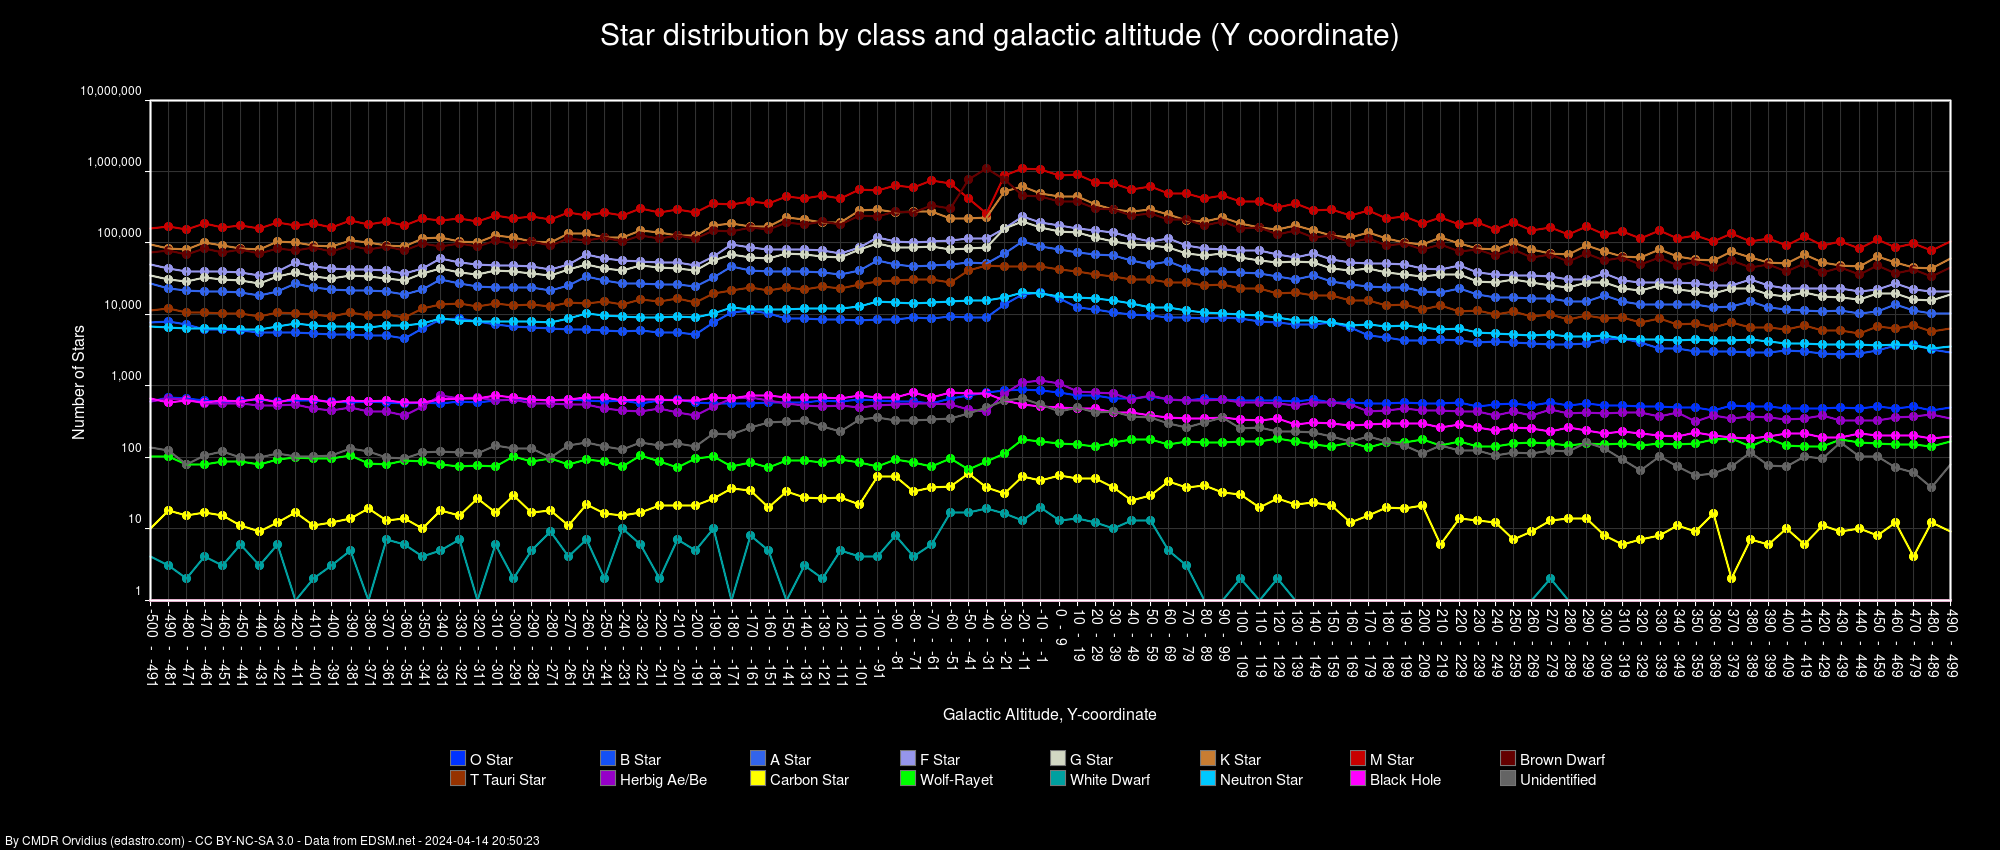
New graph, a more granular look at the population density of star types in 10ly high altitude bands. I limited it to +/- 500 lightyears due to packing it all into one image.
What's cool is that this graph shows the brown dwarf layer. In the -50 to -30 altitude, roughly, there's a sharp spike upward in the number of brown dwarfs, and a downward spike in the M-class stars. They trade places for population counts. Since this is a logarithmic graph, the numbers change quite a bit compared to how it looks.
Click to see full view, if needed:
The step like structure of some of the star types is also interesting. Anybody confident enough to speculate on the reasons for that?
Either Stellar Forge is drunk, or else (my suspicion) the abstract evolution model includes relatively frequent occurrence of high mass loss events. One possibility would be mass stripping - but in which case, where is the companion object? Another would be that in say certain metallicity ranges evolution off the main sequence results in dense winds carrying away a large fraction of the starting mass. Either case would be based on real mechanisms, although the endpoint seen here seems physically implausible.Well, kind of yeah, but the star at least has to be of proper age for for that
I mean, how could for example this particular one burn out to it's final stages of evolution for such a short period of time?
Hey. I just wanted to thank you again for the layered Wolf-Rayet maps. A lot of the credit for my first W-R discovery has to go to you.My pleasure. Have fun!
o7
Wow, you scanned 4700 stars before getting bored? I'm not surprised you can still see the pattern!I didn't do it because I wanted to leave a mark. Two years ago I suddenly thought 'let's search for carbon stars'. This 'L' is made of more than 4700 carbon stars I found until I got bored.
I recently found a cluster of 50 or so C-stars (and some Wolf-Rayets too) and gave up after scanning around 20!
Can you make life-density graph AND water planets (giants with water, water worlds, etc) on same picture?
Life-density is "stellar phenomena" and bio signals, maybe "giants with water based life".
Point is ... Carina Arms and Dryman have unusually a lot of space trees ("phenomena"), I stopped to count after couple tens met during a week. I suspect intentional intrusion, for example "close to raxxla there is more life".
So, as we know to get life happen Star Forge must have there water.
So lets say we have sector 100 waters and 5 lifes. Then another 200 water and 10 lifes, so we can assume it is 20 : 1 ....then we see some another sector with 2 : 1 - that may mean that sector was intentionally modified, i.e. "seeded by life artificially".
Btw...WR stars picture match to my observation. I was expecting to have it alot on left side, soo ... my observations show, that will be most life in Carina and till Earth those sectors.
Last edited:
The lowest blue line is for white dwarves? It looks very suspicious that there are quite some of them below -100 and almost none above +90. That can't be caused just by the greater popularity of flying to the bottom rather than to the top?New graph, a more granular look at the population density of star types in 10ly high altitude bands
Last edited:
The reason for why the SCA and Dryman's regions have lots of peduncle trees is quite simple. It's the same as why the IOS (Inner Orion Spur) has lots of albulum gourd molluscs - see these maps: these forms of life have rather relaxed spawning restrictions, and their spawning area covers their entire regions. Most often, life inside a region appears in only a smaller part of the region otherwise.Point is ... Carina Arms and Dryman have unusually a lot of space trees ("phenomena"), I stopped to count after couple tens met during a week. I suspect intentional intrusion, for example "close to raxxla there is more life".
The albulum gourd molluscs would show up neatly with life-bearing worlds, of course, since they spawn in systems which have to have an ELW or WW or GGWL or WG or class II GG present. Same goes for the peduncles. The only difference between them is that the peduncle trees require an F/G/K/M star present in the system, while the albulum gourds require a T dwarf present in the system. (In practice, these are often around B/A/F main stars.)
Can you make life-density graph AND water planets (giants with water, water worlds, etc) on same picture?
Life-density is "stellar phenomena" and bio signals, maybe "giants with water based life".
Unfortunately I don't have any data on bio signals or anything like that. I could make a combined map of planet types, definitely. I'm just wondering what would make the most sense. ELWs and AWs certainly count as life-bearing, but also would be hard to see when mixed in with water worlds, and gas giants with life.
The lowest blue line is for white dwarves? It looks very suspicious that there are quite some of them below -100 and almost none above +90. That can't be caused just by the greater popularity of flying to the bottom rather than to the top?
Part of the problem is that the graph is only covering +/- 500 ly from the plane, and I think the majority of those are in the +/- 1000 ly fields along with the neutron stars and black holes. Even on the left side, it's typically only 2-5 of them there. If the graph were extended out to +/- 1500 ly, the numbers would go way up further out on the sides.
Now I'm getting tempted to extend the graph, but it may have to get super wide. One of the main reasons for making this graph was to be granular enough to see that brown dwarf layer. Maybe wide is OK. I might have to toy with it.
To address both of these, I have two things in the works. It's slow going since today is an automatic update day (because of course, it always works out that way).
* A second, wider copy of the graph. It will cover +/- 1500 ly, and will require a bit of scrolling in the browser to see it all.
* A life-capable worlds map. Right now I have it set to include ELW, AW, WW, Water giants, and gas giants with either type of life. Of course this doesn't include airless landables with bio signals, or anything like that, but since these can be prerequisites for surface life, it's at least meaningful in that context.